Market Update — February 2024

We firmly believe timely and relevant data is key to making good decisions. To this end, we are committed to providing our community and clients with actionable data and insights about the local real estate market.
Local real estate market
With the data from January 2024 in, here’s an overview of the key aspects of the local real estate market. The real estate data below is collected from Northwest Multiple Listing Service (NWMLS).
Median price: The chart below shows the latest median sales prices of homes over the past three years in the Greater Seattle area over the past three years:

Homes sold: 3,364 homes were sold in January 2024 with the median price of $593,500, which represents a +6.5% growth YOY. This translates to a dollar value of about $2.4B.
New construction: 617 new construction homes were sold in January 2024. The median sale price of new construction homes was $700,000.
Months of inventory: Inventory has shrunk by about 16.4% YOY. Given the current quantity of supply, it’ll take around 2.1 months for every listed home to sell. To put this number in context, note that the months of inventory for a balanced market is considered to be 4 to 6 months. The four counties with the lowest months of inventory in January 2024 were Snohomish (0.84), Thurston (1.69), King (1.78), and Pierce (1.82). So the current data confirms the enduring shortage of supply relative to demand in the area.
New listings: 4,954 new listings were added to the NWMLS database in January 2024. This is an increase of 0.6% from January 2023.
Mortgage rates: The Freddie Mac rate has edged down from it’s high in November 2023 approaching 6.6%.
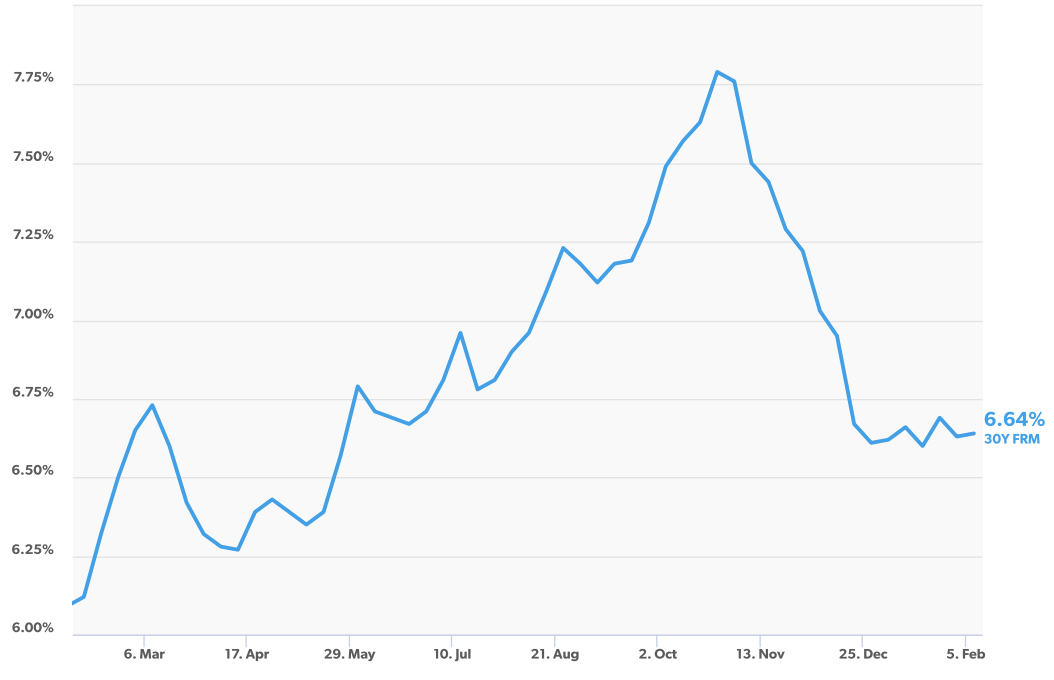
Average 30-Year Fixed Mortgage Rates over the past 12 months (Source: Freddie Mac)
Broader economy
Fed Funds Rate Likely at Its Peak: After a period of aggressive rate hikes that began in March 2022, the Fed once again left their benchmark Federal Funds Rate unchanged at a range of 5.25% to 5.5%. This decision was unanimous and marked the fourth straight meeting where the Fed paused additional hikes.
Home Prices Moving on Up: The Case-Shiller Home Price Index, which is considered the “gold standard” for appreciation, showed home prices nationwide rose 0.2% from October to November after seasonal adjustment. This marked the tenth straight month of gains and a new record high. Home values in November were also 5.1% higher than a year earlier, with S&P DJI’s Head of Commodities, Brian D. Luke, noting that “November’s year-over-year gain saw the largest growth in U.S. home prices in 2023.” The Federal Housing Finance Agency’s (FHFA) House Price Index also saw home prices rise 0.3% from October to November and 6.6% year-over-year, with their index setting new record highs in home prices every month since February. Note that FHFA’s report measures home price appreciation on single-family homes with conforming loan amounts, which means it most likely represents lower-priced homes. FHFA also does not include cash buyers or jumbo loans, and these factors account for some of the differences in the two reports.