Market Update — March 2024

We firmly believe timely and relevant data is key to making good decisions. To this end, we are committed to providing our community and clients with actionable data and insights about the local real estate market.
Local real estate market
With the data from February 2024 in, here’s an overview of the key aspects of the local real estate market. The real estate data below is collected from Northwest Multiple Listing Service (NWMLS).
Median price: The chart below shows the latest median sales prices of homes over the past three years in the Greater Seattle area over the past three years:
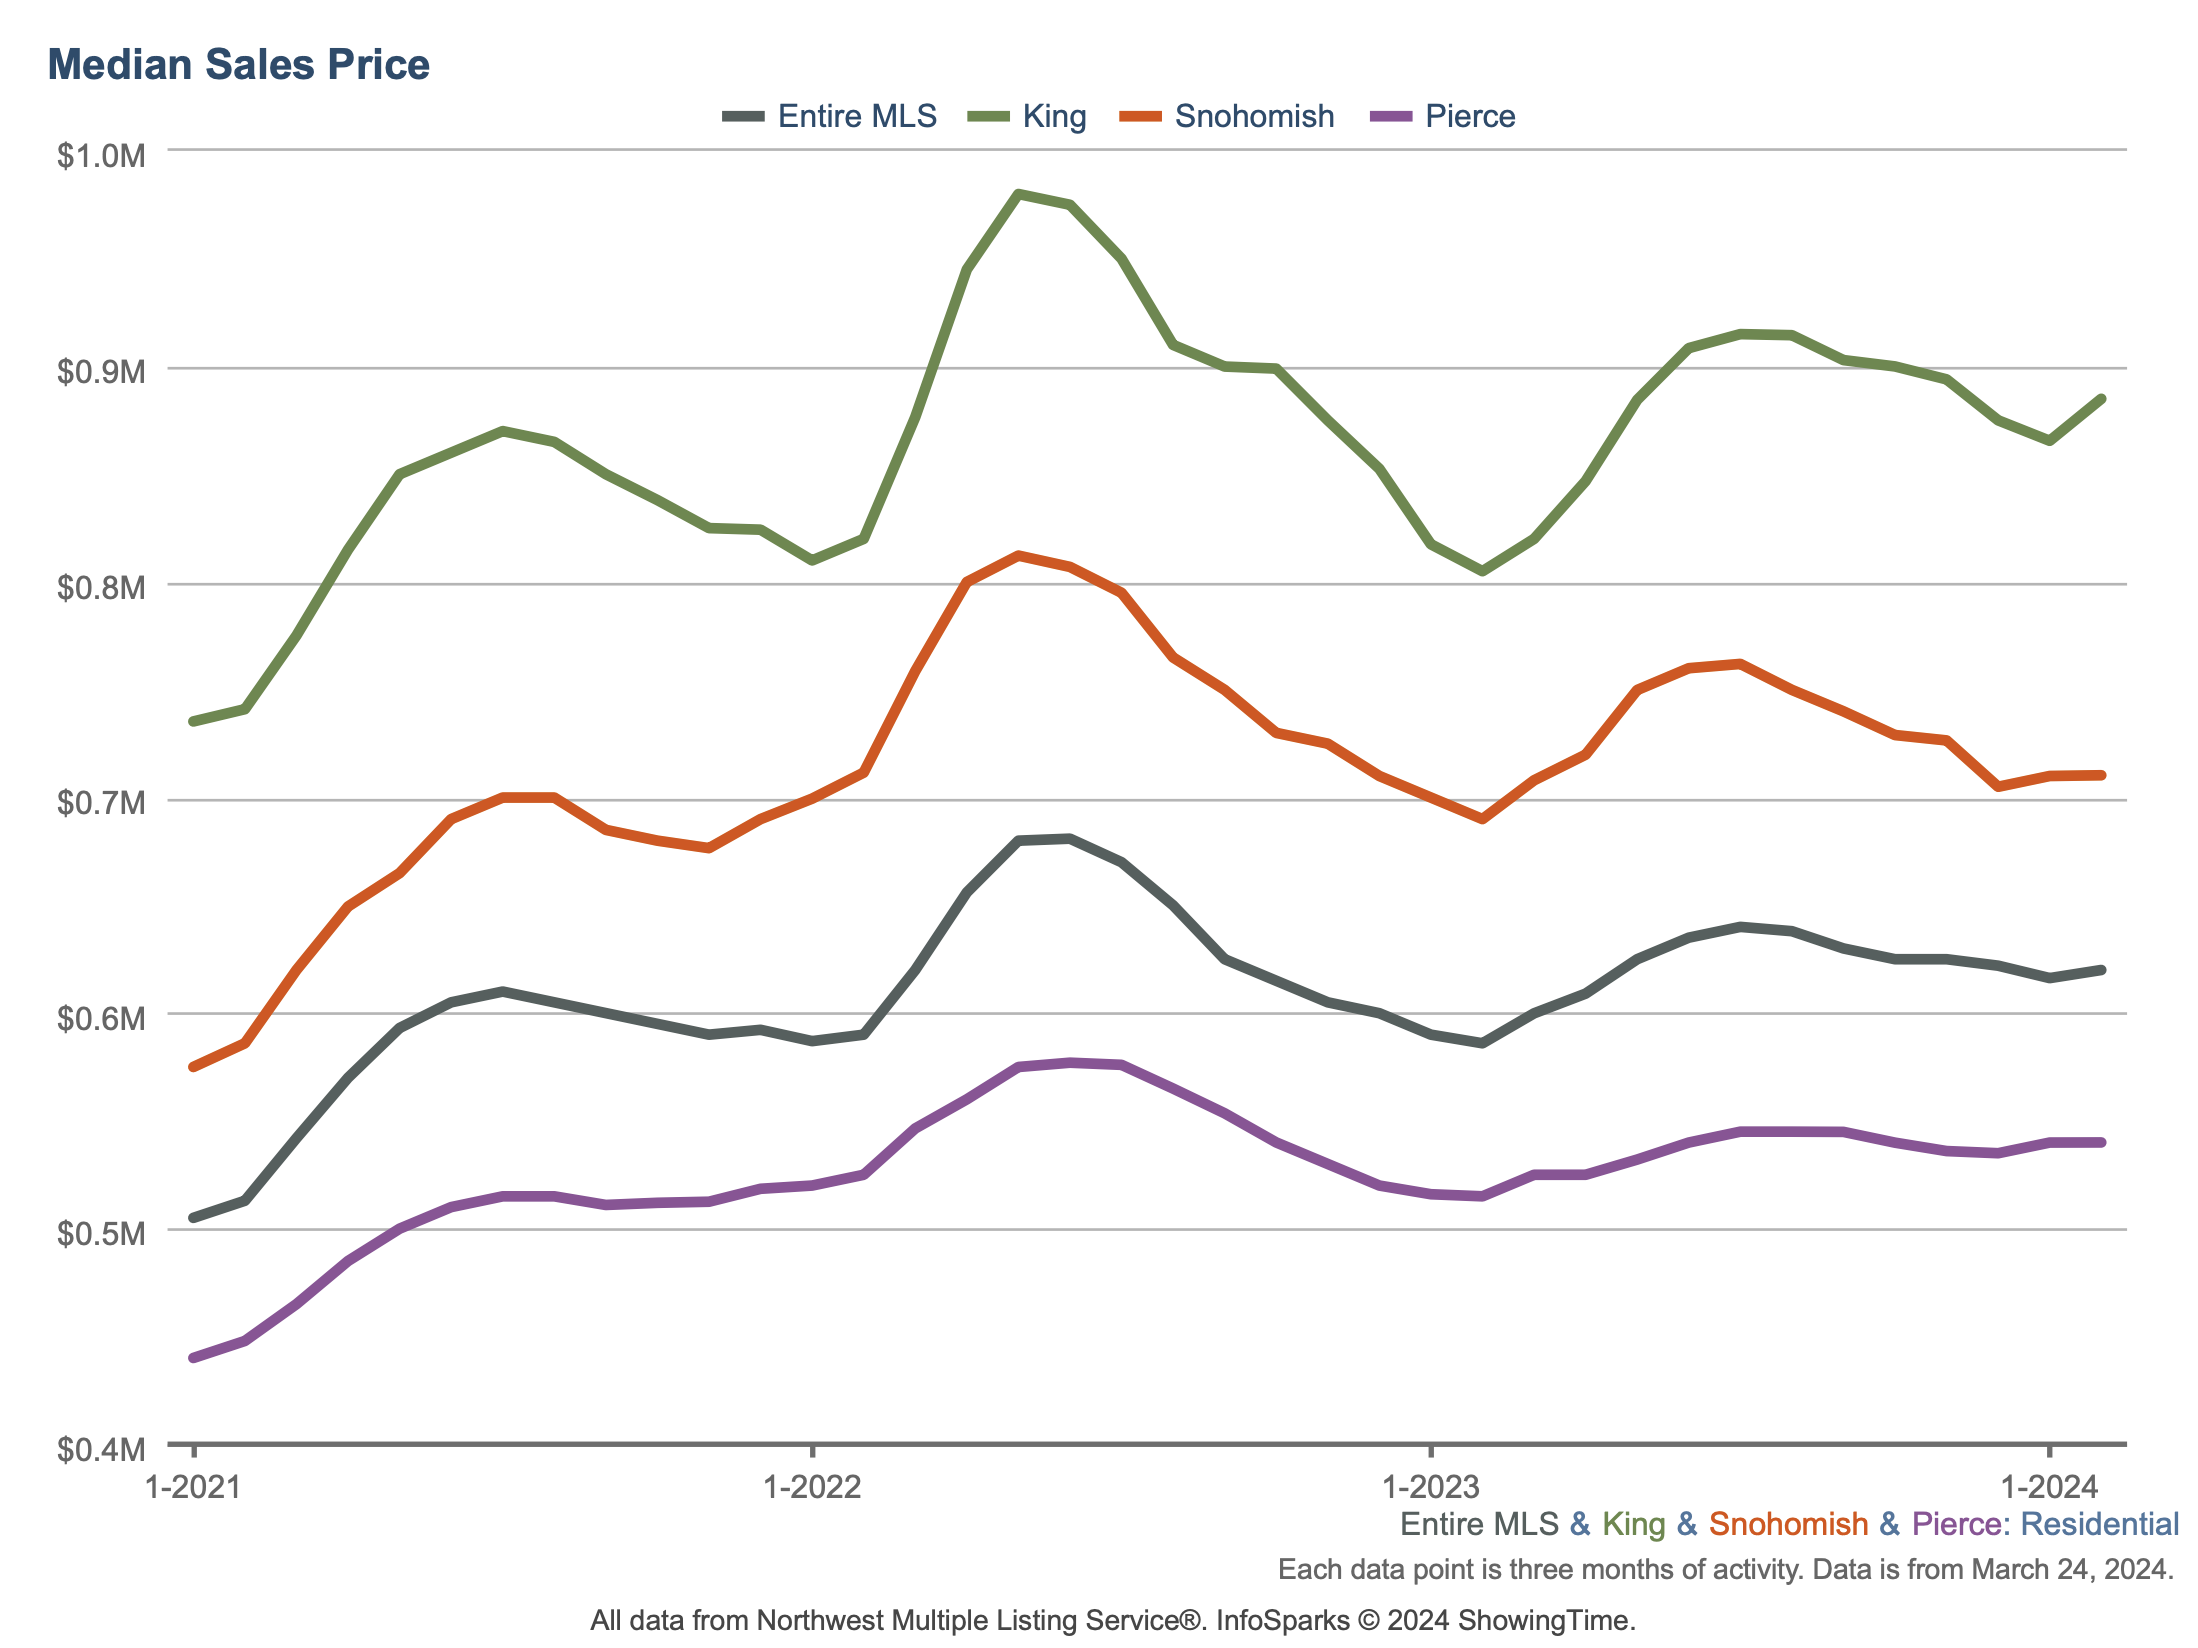
Homes sold: 4,189 homes were sold in February 2024. The median price of $608,111 which represents a +6% growth YOY. This translates to a dollar value of about $3.2B.
New construction: 848 new construction homes were sold in February 2024. The median sale price of new construction homes was $730,000.
Months of inventory: Given the current quantity of supply, it’ll take around 1.8 months for every listed home to sell. To put this number in context, note that the months of inventory for a balanced market is considered to be 4 to 6 months. The four counties with the lowest months of inventory in February 2024 were Snohomish (0.88), King (1.47), Pierce (1.60), and Thurston (1.71). So the current data confirms the enduring shortage of supply relative to demand in the area.
New listings: 6,153 new listings were added to the NWMLS database in February 2024. This is an increase of 25% from February 2023.
Mortgage rates: The Freddie Mac rate has edged and stayed down from it’s high in October/November 2023.
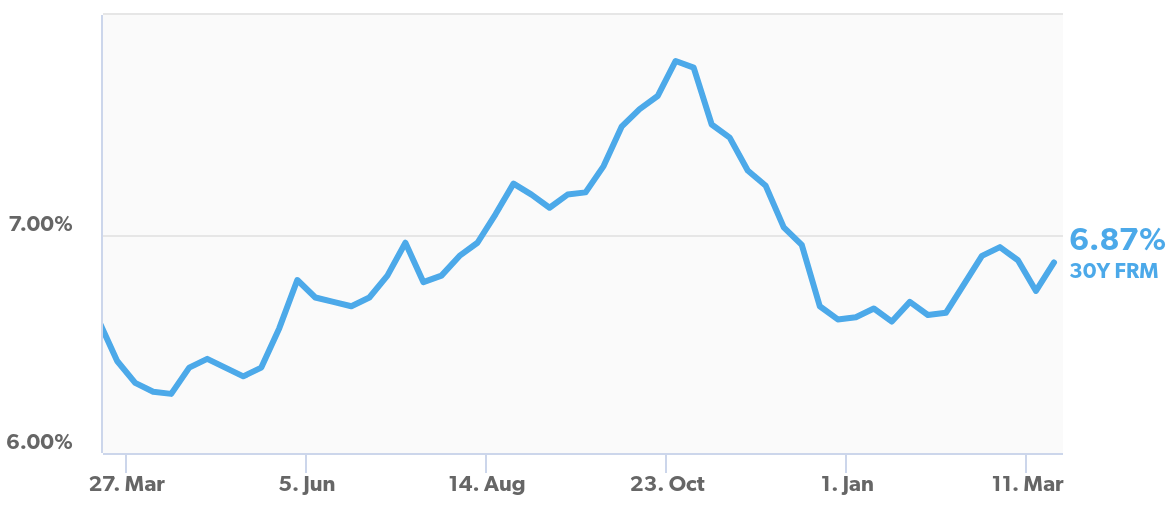
Average 30-Year Fixed Mortgage Rates over the past 12 months (Source: Freddie Mac)
Broader economy
Consumer inflation: The latest Consumer Price Index (CPI) showed that inflation rose 0.4% from January to February, coming in right around forecasts. CPI also rose from 3.1% to 3.2% year over year, which was above the expected unchanged reading. Core CPI, which strips out volatile food and energy prices, increased 0.4% while the annual reading fell from 3.9% to 3.8%. Both figures were slightly higher than estimates.
Wholesale inflation: The Producer Price Index (PPI), which measures inflation on the wholesale level, rose 0.6% in February, doubling market estimates. On an annual basis, PPI rose from 1% to 1.6%, well above the 1.1% that was forecasted. Core PPI, which strips out volatile food and energy prices, was hotter than expected with a 0.3% rise. The year-over-year reading remained at 2%, just above forecasts.