Market Update — July 2023

We believe timely and relevant data is key to making good decisions. To this end, we are committed to providing our community and clients with actionable data and insights about the local real estate market.
Local real estate market
With the data from June 2023 in, here’s an overview of the key aspects of the local real estate market. The real estate data below is collected from Northwest Multiple Listing Service (NWMLS).
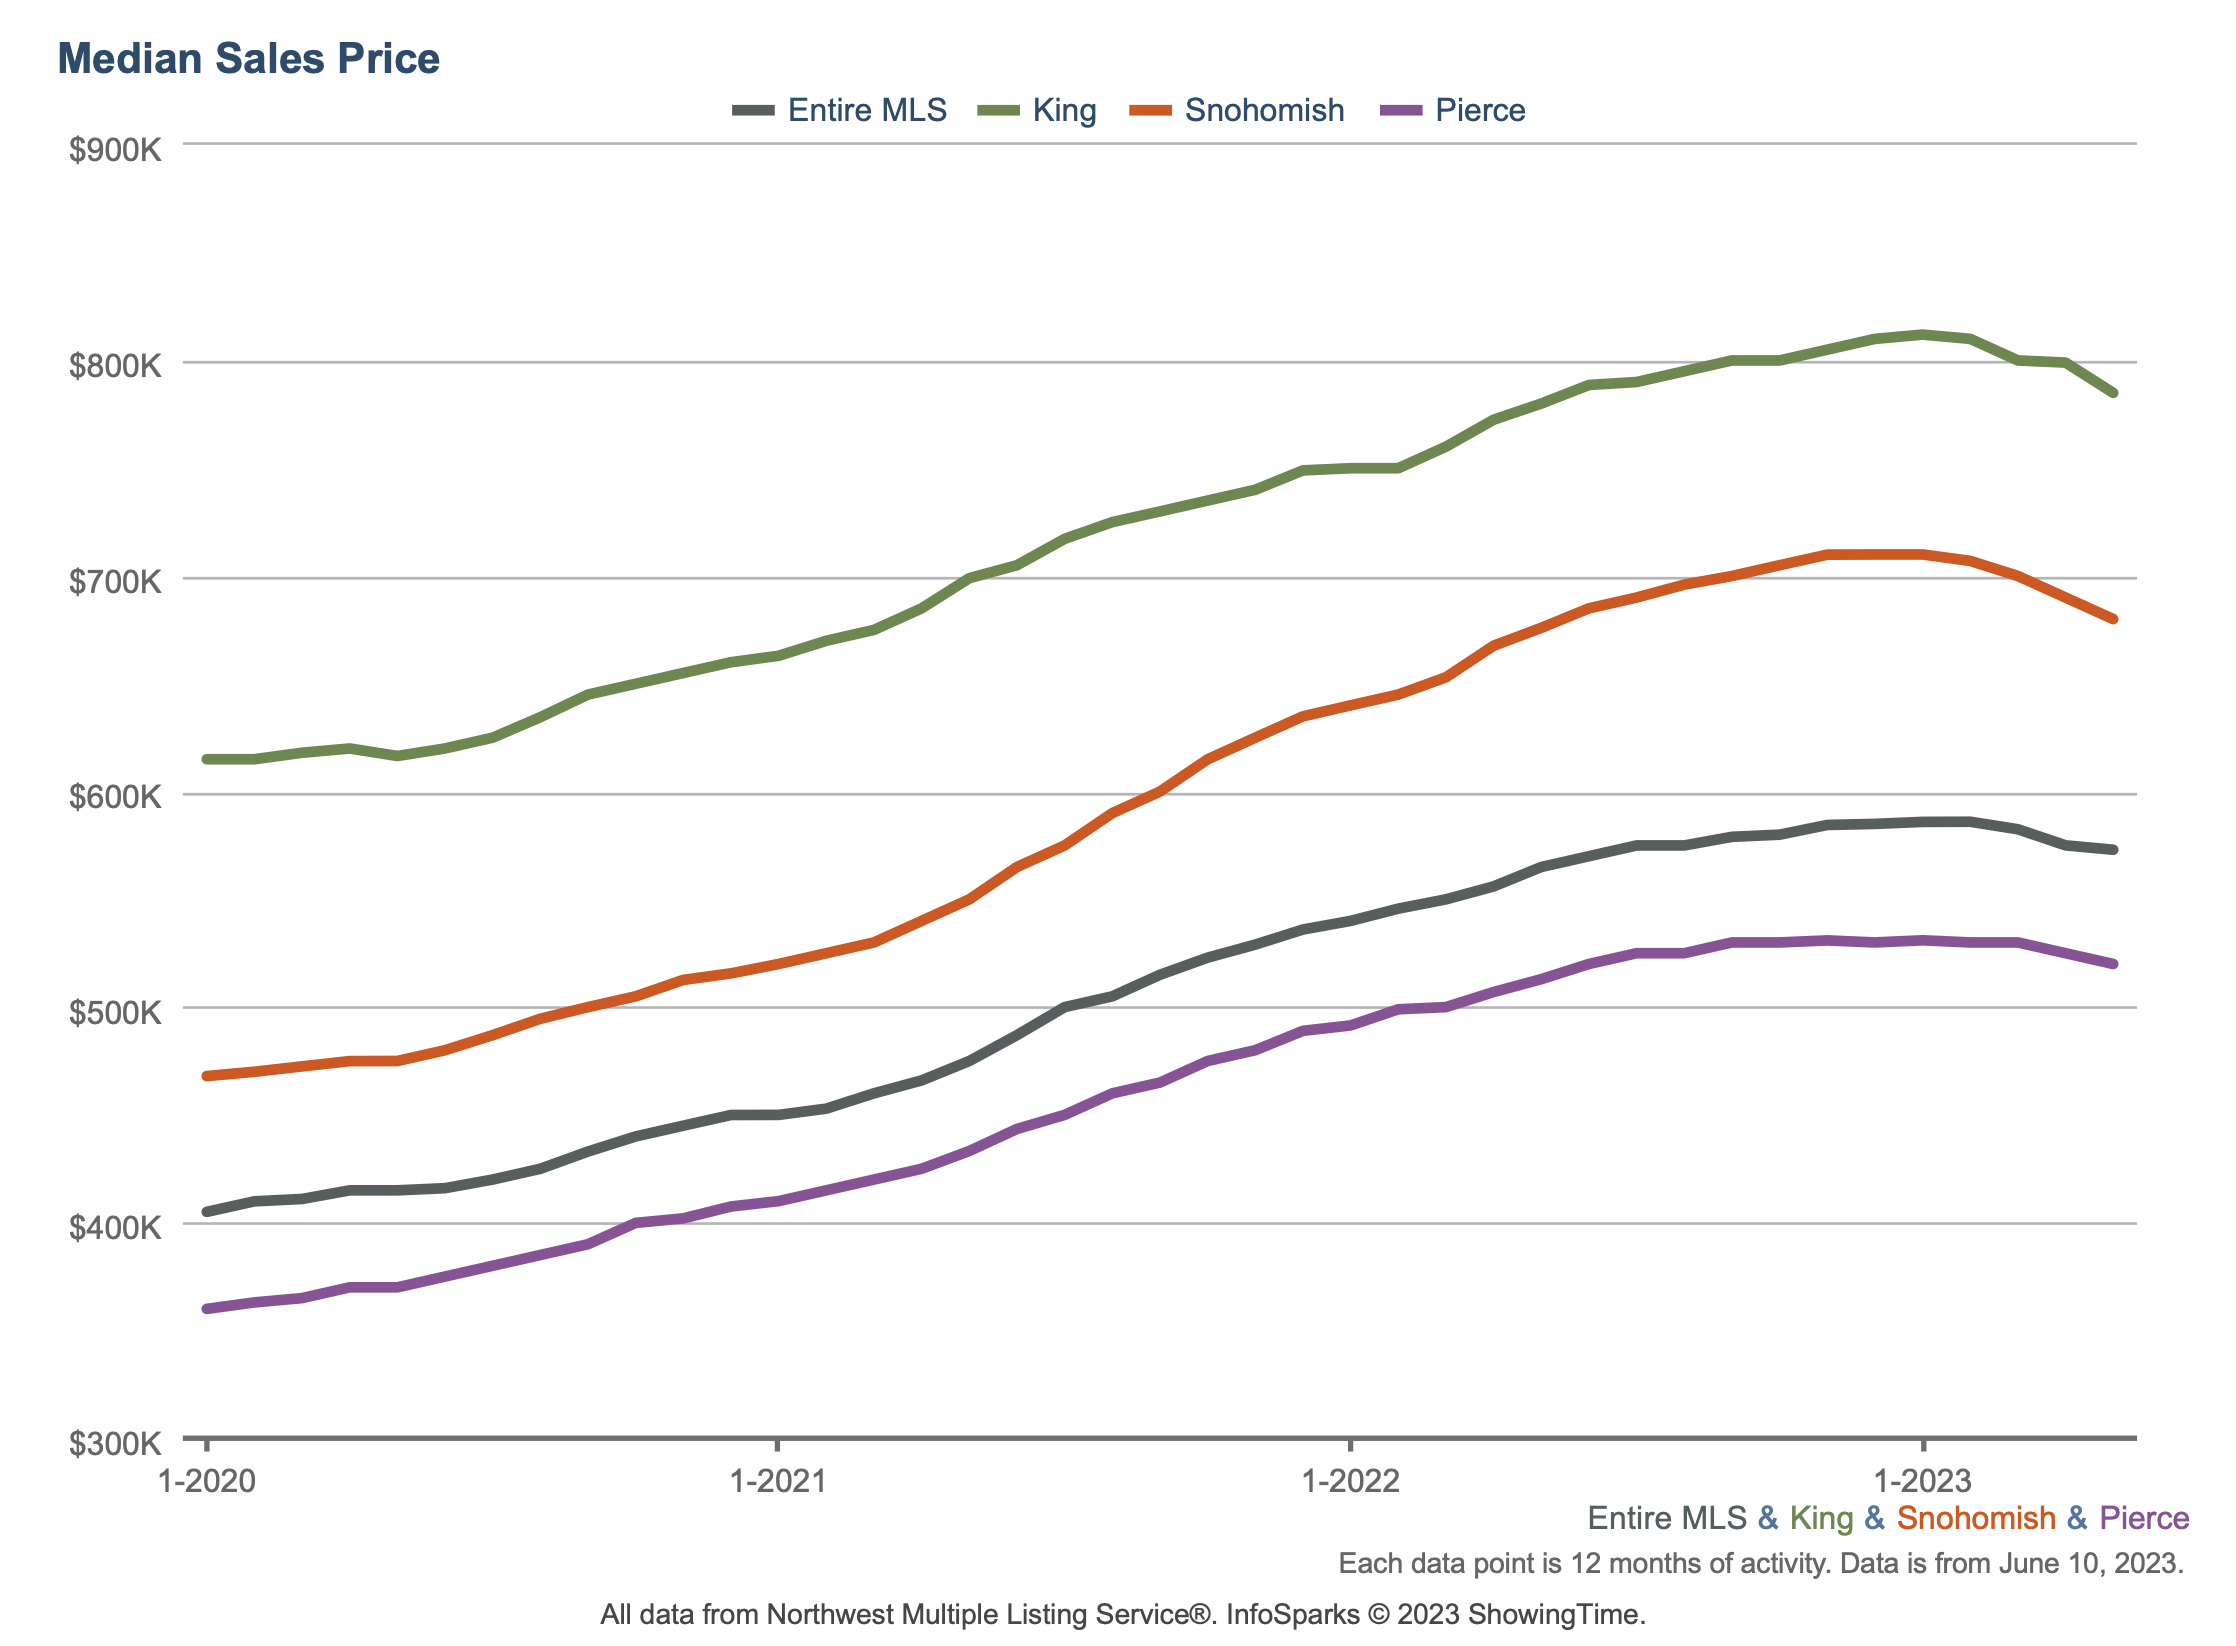
Median price: The chart below shows the latest median sales prices of homes over the past three years in the Greater Seattle area over the past three years:

New construction: 885 new construction homes were sold in June 2023. The median sale price of new construction homes was $692,755.
Months of inventory: At the current rate of sales, it’ll take around 1.5 months for every listed home to sell. To put this number in context, note that the months of inventory for a balanced market is considered to be 4 to 6 months. So the current value of around 1.5 months confirms the enduring shortage of supply relative to demand in the area.
Homes sold: 6,842 homes were sold in June 2023 with the median price of $625,000. This translates to a dollar value of $5.3B.
New listings: 9,481 new listings were added to the NWMLS database in June 2023. This is a decrease of -33.3% from June 2022, which exacerbates the low supply. This indicates fewer property owners are likely to be interested in selling their homes exacerbating the chronic shortage of supply.
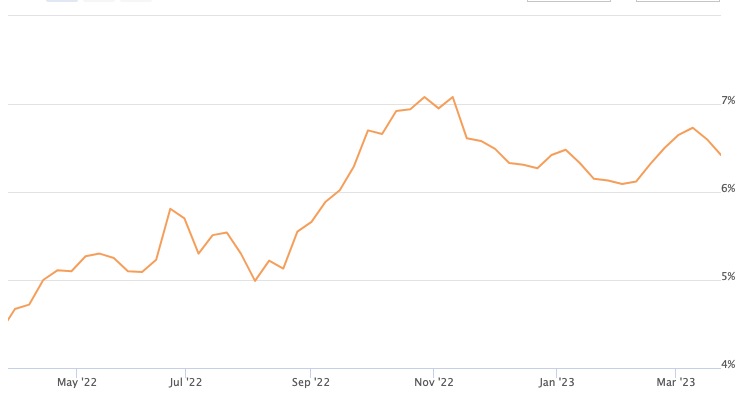
Mortgage rates: The Freddie Mac rate has been slightly edging up over the past month.
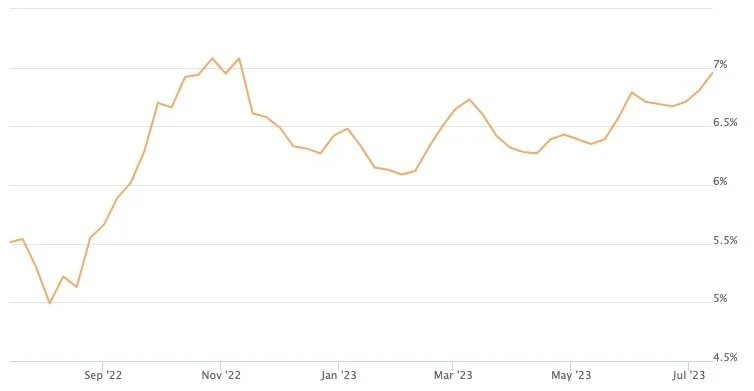
Average 30-Year Fixed Mortgage Rates — July 2022 to July 2023 (Source: Freddie Mac)
Broader economy
The Bureau of Labor Statistics (BLS) reported that there were 209,000 jobs created in June, which was weaker than estimates of 240,000. Job growth in April and May was also revised lower, subtracting 110,000 jobs in those months combined. The unemployment rate declined slightly from 3.7% to 3.6%, though it’s still above April’s reading of 3.4%.
The minutes from the Fed’s June meeting showed that the Fed is planning additional hikes to their benchmark Fed Funds Rate this year. This is the interest rate for overnight borrowing for banks and it is not the same as mortgage rates. When the Fed hikes the Fed Funds Rate, they are trying to slow the economy and curb inflation.
Market Update — June 2023
We believe timely and relevant data is key to making good decisions. To this end, we are committed to providing our community and clients with actionable data and insights about the local real estate market.
Local real estate market
With the data from May 2023 in, here’s an overview of the key aspects of the local real estate market. The real estate data below is collected from Northwest Multiple Listing Service (NWMLS).
Median price: The chart below shows the latest median sales prices of homes over the past three years in the Greater Seattle area over the past three years:
New construction: 851 new construction homes were sold in May 2023. The median sale price of new construction homes was $699,995.
Months of inventory: At the current rate of sales, it’ll take around 1.5 months for every listed home to sell. To put this number in context, note that the months of inventory for a balanced market is considered to be 4 to 6 months. So the current value of around 1.5 months confirms the persistent shortage of supply relative to demand in the area.
Homes sold: 6,310 homes were sold in May 2023. This translates to a dollar value of $4.7B.
New listings: 9,427 new listings were added to the NWMLS database in May 2023. This is a decrease of -29.3% from May 2022, which exacerbates the low supply. This indicates fewer property owners are likely to be interested in selling their homes exacerbating the chronic shortage of supply.
Mortgage rates: The Freddie Mac rate shows no major change over the past month.
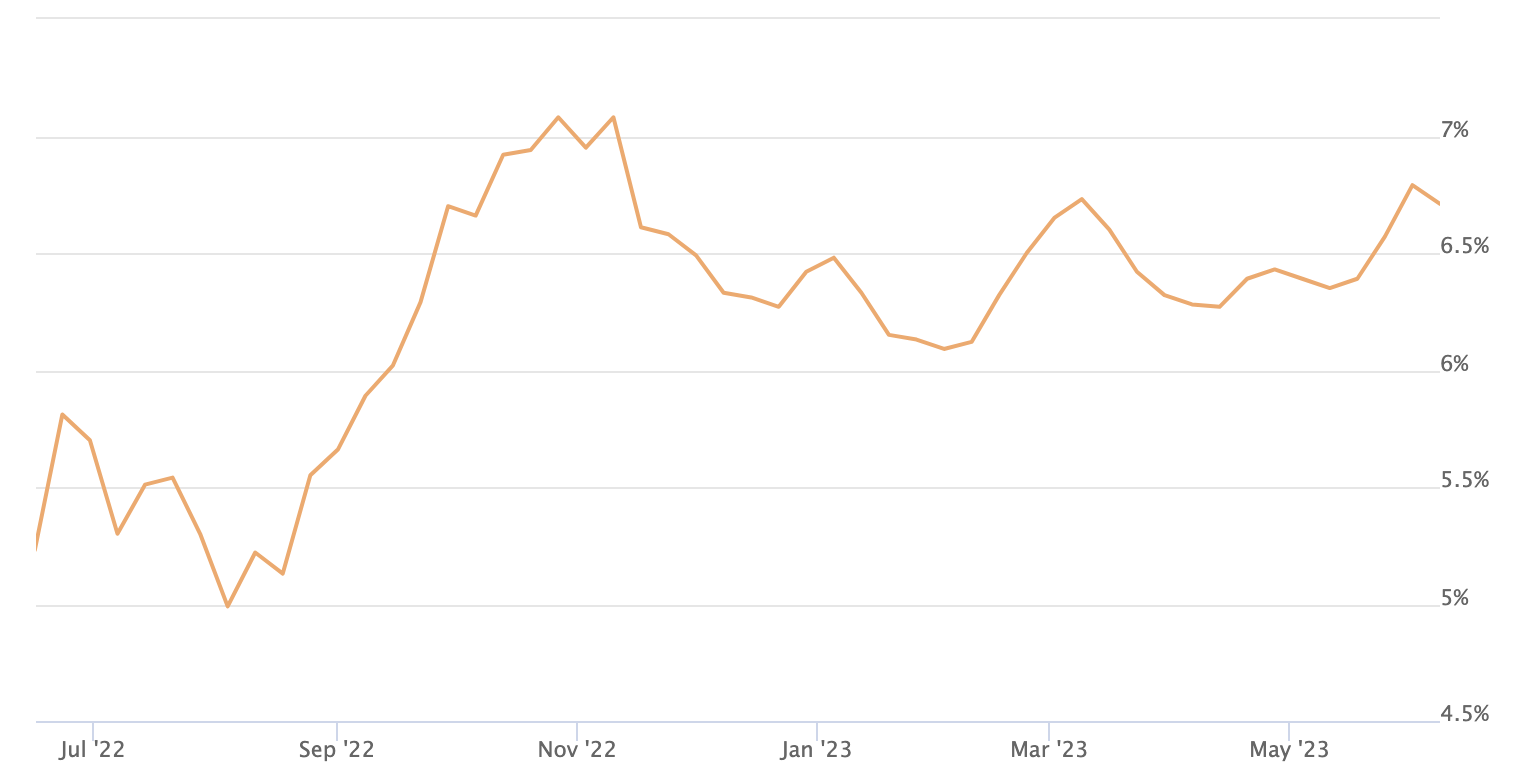
30 Year Fixed Mortgage Rates — June 2022 to June 2023 (Source: Freddie Mac)
Broader economy
The Bureau of Labor Statistics (BLS) reported that there were 339,000 jobs created in May, which was much larger than estimates. Job growth in March and April was also revised higher, adding 93,000 additional jobs in those months combined. The unemployment rate rose from 3.4% to 3.7%.
The Case-Shiller Home Price Index, which is considered the “gold standard” for appreciation, showed home prices nationwide rose 0.4% from February to March after seasonal adjustment. This follows the 0.3% monthly gain seen in February. Home prices were also 0.7% higher when compared to March 2022, though this annual reading is a decline from the 2.1% gain reported in February.
Private payrolls were much stronger than expected last month, as the ADP Employment Report showed that there were 278,000 jobs created in May. Annual pay for job stayers increased 6.5% and job changers saw an average increase of 12.1%. While these figures are still high, they reflect a year-long slowdown and lower wage-pressured inflation.
Market Update — May 2023
We believe timely and relevant data is key to making good decisions. To this end, we are committed to providing our community and clients with actionable data and insights about the local real estate market.
Local real estate market
With the data from April 2023 in, here’s an overview of the key aspects of the local real estate market. The real estate data below is collected from Northwest Multiple Listing Service (NWMLS).
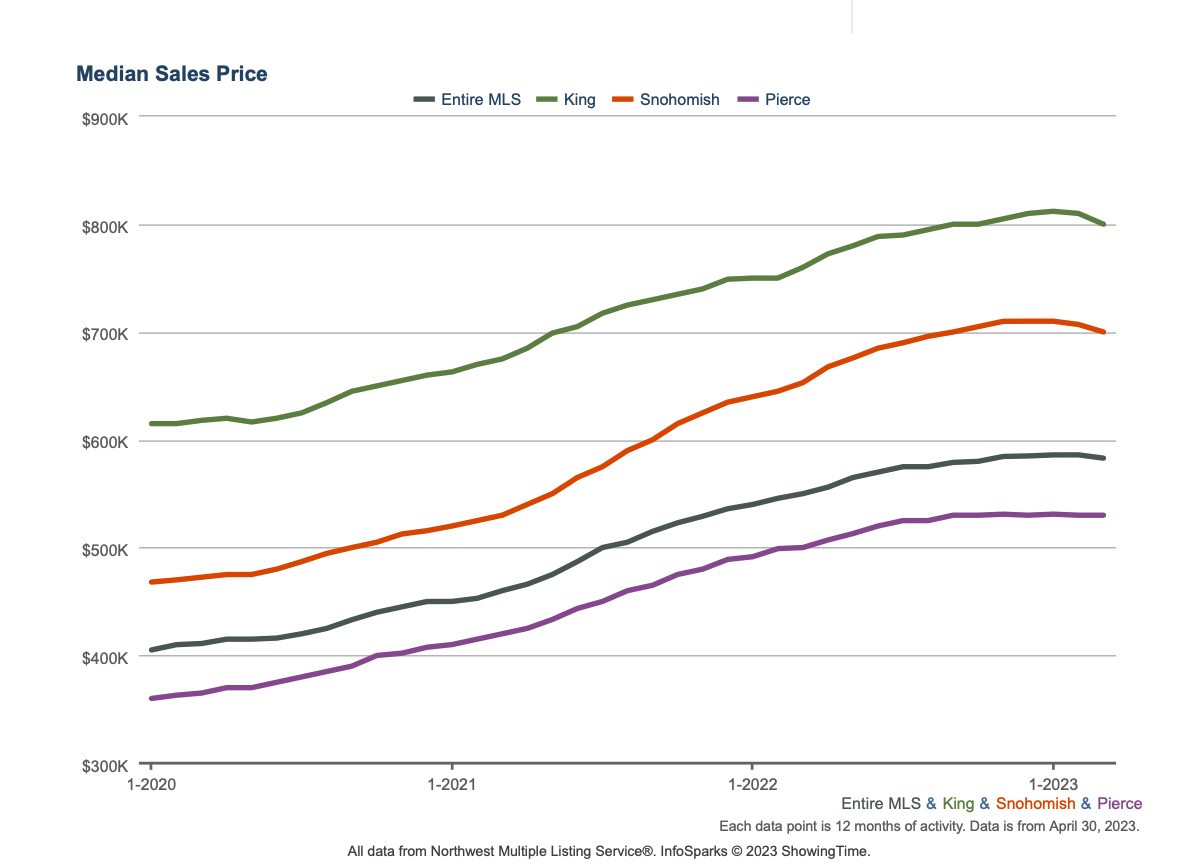
Median price: The chart below shows the latest median sales prices of homes over the past five years. Since our buyers typically buy properties in King, Snohomish, and Pierce Counties, here’s the Year-Over-Year (YOY) median closed price increase in these counties over the past 12 months:
King: +3.4%
Snohomish: +3.3%
Pierce: +3.6%
To put these numbers in perspective, S&P 500 and Nasdaq have moved by 0.9% and 5.5% YOY, respectively. Of course, to make it apples to apples when comparing investing in the stock market vs. real estate, depending on your specific scenario, you also need to account to for the impact of leverage (meaning purchasing with borrowed money) and tax benefits. Leverage and tax benefits tend to significantly increase the return on investment (ROI) for real estate relative to mere asset appreciation presented above.
And here are the median sale prices of residential properties in the Greater Seattle area over the past three years:

New construction: 754 new construction homes were sold in April 2023. The median sale price of new construction homes was $733,625.
Months of inventory: At the current rate of sales, it’ll take around 1.5 months for every listed home to sell. To put this number in context, note that the months of inventory for a balanced market is considered to be 4 to 6 months. So the current value of around 1.5 months confirms the persistent shortage of supply relative to demand in the area.
Homes sold: 5,334 homes were sold in April 2023. This translates to a dollar value of $4B.
New listings: 7,303 new listings were added to the NWMLS database in April 2023. This is a decrease of -37.5% from April 2022, which exacerbates the low supply. This indicates fewer property owners are likely to be interested in selling their homes exacerbating the chronic shortage of supply.
Mortgage rates: The Freddie Mac rate shows no major change over the past month.

30 Year Fixed Mortgage Rates — May 2022 to May 2023 (Source: Freddie Mac)
Broader economy
The Fed hiked their benchmark Fed Funds Rate by 25 basis points at their meeting last Wednesday, bringing it to a range of 5% to 5.25%.
Private payrolls nearly doubled expectations last month, as the ADP Employment Report showed that there were 296,000 jobs created in April. Annual pay for job stayers increased 6.7% and job changers saw an average increase of 13.2%. While these figures are still high, they reflect a year-long slowdown and lower wage-pressured inflation, with job-changers in particular seeing the slowest pace of pay growth since November 2021.
CoreLogic’s Home Price Index showed that home prices nationwide rose by 1.6% from February to March and they were 3.1% higher when compared to March of last year. This follows February’s 0.8% rise in home prices, suggesting that the housing market is at a turning point. CoreLogic forecasts that home prices will rise 0.8% in April and 4.6% in the year going forward, which is an upward revision from 3.7% in February’s report.
Market Update — April 2023
We believe timely and relevant data is key to making good decisions. To this end, we are committed to providing our community and clients with actionable data and insights about the local real estate market.
Local real estate market
With the data from March 2023 in, here’s an overview of the key aspects of the local real estate market. The real estate data below is collected from Northwest Multiple Listing Service (NWMLS).
Median price: The chart below shows the latest median sales prices of homes over the past five years. Since our buyers typically buy properties in King, Snohomish, and Pierce Counties, here’s the Year-Over-Year (YOY) median closed price increase in these counties over the past 12 months:
King: +5.2%
Snohomish: +7.2%
Pierce: +5.7%
To put these numbers in perspective, S&P 500 and Nasdaq have moved by 0.1% and 0.6% YOY, respectively.
And here are the median sold prices of residential properties in the Greater Seattle area over the past three years:
New construction: 1,050 new construction homes were sold in March 2023. The median sale price of new construction homes was $699,990.
Months of inventory: At the current rate of sales, it’ll take more than one month for every listed home to sell. To put this number in context, note that the months of inventory for a balanced market is considered to be 4 to 6 months. So the current value of around 1 confirms the persistent shortage of supply relative to demand in the area.
Homes sold: 5,817 homes were sold in March 2023. This translates to a dollar value of $4.2B.
New listings: 7,904 new listings were added to the NWMLS database in March 2023. This is a decrease of -29% from March 2022, which exacerbates the low supply. This indicates fewer property owners are interested in selling their homes exacerbating the chronic shortage of supply.
Mortgage rates: The Freddie Mac rate showed a 30 basis point decrease from mid-March 2023 to mid-April 2023. The market is awaiting the Fed decision on the base rate in May.

30 Year Fixed Mortgage Rates — April 2022 to April 2023 (Source: Freddie Mac)
Broader economy
Initial Jobless Claims continued to move higher this month, with the number of people filing for unemployment benefits for the first time rising by 5,000 in the latest week to 245,000. This tied the third highest reading so far this year. Continuing Jobless Claims also surged to 1.865 million, up 61,000.
The Conference Board released their Leading Economic Index (LEI) for March, which was down 1.2%, falling to “its lowest level since November of 2020, consistent with worsening economic conditions ahead,” said Justyna Zabinska-La Monica, Senior Manager, Business Cycle Indicators. This report is a composite of economic indexes and can signal peaks and troughs in the business cycle.
Market Update — March 2023
We believe timely and relevant data is key to making good decisions. To this end, we are committed to providing our community and clients with actionable data and insights about the local real estate market.
Local real estate market
With the data from February 2023 in, here’s an overview of the key aspects of the local real estate market. The real estate data below is collected from Northwest Multiple Listing Service (NWMLS).
Median price: The chart below shows the latest median sales prices of homes over the past five years. Since our buyers typically buy properties in King, Snohomish, and Pierce Counties, here’s the Year-Over-Year (YOY) median closed price increase in these counties over the past 12 months:
King: +8%
Snohomish: +9.5%
Pierce: +6.2%
To put these numbers in perspective, S&P 500 and Nasdaq have moved by -6.2% and 1.7% YOY, respectively.
And here are the median sold prices of residential properties in the Greater Seattle area over the past three years:

New construction: 737 new construction homes were sold in February 2023. The median sale price of new construction homes was $710,000.
Months of inventory: At the current rate of sales, it’ll take 1.5 months for every listed home to sell. To put this number in context, note that the months of inventory for a balanced market is considered to be 4 to 6 months. So the current value of 1.5 confirms the persistent shortage of supply relative to demand in the area.
Homes sold: 4,258 homes were sold in February 2023. This translates to a dollar value of $2.9B.
New listings: 5,231 new listings were added to the NWMLS database in February 2023. This is a decrease of -34% from February 2022, which exacerbates the low supply. This indicates fewer property owners are interested in selling their homes exacerbating the chronic shortage of supply.
Mortgage rates: The Fed hiked its benchmark Fed Funds Rate by 25 basis points (meaning 0.25%) at its meeting earlier this month, marking the ninth hike since March 2022 and bringing it to a range of 4.75% to 5%. The Fed Funds Rate is the interest rate for overnight borrowing for banks and it is not the same as mortgage rates. When the Fed hikes the Fed Funds Rate, they are trying to slow the economy and curb inflation.
30 Year Fixed Mortgage Rates — March 2022 to March 2023 (Source: Freddie Mac)
Broader economy
Nationally, home sales rose 14.5% from January to February to a 4.58 million unit annualized pace, per the National Association of Realtors (NAR), coming in much stronger than estimates and ending twelve consecutive months of declines. Sales were 22.6% lower than they were in February of last year, though this is less than the nearly 37% annual decline seen in January. This report measures closings on existing homes, which represent around 90% of the market, making it a critical gauge for taking the pulse of the housing sector.
February’s data showed signs of strength in the housing market, despite media headlines to the contrary. For example, while there was a 0.2% decline in the median home price to $363,000 from a year earlier, this is not the same as a decline in home prices as some reports implied. The median home price simply means half the homes sold were above that price and half were below it, and this figure can be skewed by the mix of sales among lower-priced and higher-priced homes. Real appreciation data per the la
Market Update — February 2023
We believe timely and relevant data is key to making good decisions. To this end, we are committed to providing our community and clients with actionable data and insights about the local real estate market.
Local real estate market
With the data from January 2023 in, here’s an overview of the key aspects of the local real estate market. The real estate data below is collected from Northwest Multiple Listing Service (NWMLS).
Median price: The chart below shows the latest median sales prices of homes over the past five years. Since our buyers typically buy properties in King, Snohomish, and Pierce Counties, here’s the Year-Over-Year (YOY) median closed price increase in these counties over the past 12 months:
King: +8.3%
Snohomish: +10.9%
Pierce: +8.1%
To put these numbers in perspective, S&P 500 and Nasdaq have moved by -8% and -3.4% YOY, respectively.
And here are the median sold prices of residential properties in the Greater Seattle area over the past three years:

New construction: 488 new construction homes were sold in January 2023. The median sale price of new construction homes was $735,990.
Months of inventory: At the current rate of sales, it’ll take 2.5 months for every listed home to sell. To put this number in context, note that the months of inventory for a balanced market is considered to be 4 to 6 months. So the current value of 2.5 confirms the persistent shortage of supply relative to demand in the area.
Homes sold: 3,264 homes were sold in January 2023. This translates to a dollar value of $2.18B.
New listings: 4,925 new listings were added to the NWMLS database in January 2023. This is a decrease of -16.9% from January 2022, which exacerbates the low supply. This indicates fewer property owners are interested in selling their homes exacerbating the chronic shortage of supply.
Mortgage rates: Mortgage rates have climbed down from their peak in October 2022 and edged lower since January 2023. The majority of January was characterized by sharp decline in mortgage rate volatility and the lowest rates in several months, the first week of February has done its best to erase that progress. This is a process that began in earnest after last week's jobs report, but it continued into the current week. Part of the reason for yesterday's move toward higher rates was the market's anticipation for today's comments from Fed Chair Powell. Buying down rates remains a popular strategy for buyers to lock in lower rates.

30 Year Fixed Mortgage Rates — February 2022 to February 2023 (Source: Freddie Mac)
Broader economy
Are More Fed Rate Hikes Ahead This Year? As expected, the Fed hiked its benchmark Fed Funds Rate by 25 basis points at its meeting last Wednesday. The Fed has now hiked the Fed Funds Rate eight times since last March, bringing it to a range of 4.5% to 4.75%. The Fed Funds Rate is the interest rate for overnight borrowing for banks and it is not the same as mortgage rates. When the Fed hikes the Fed Funds Rate, they are trying to slow the economy and curb inflation.
Fed Chair Jerome Powell acknowledged that inflation has been declining, which he noted was encouraging. However, he said the Fed has more work to do to ensure inflation is on a sustained downward path. He emphasized that the Fed would continue to make their “decisions meeting by meeting, taking into account the totality of incoming data and their implications for the outlook for economic activity and inflation.”
Market Update — January 2023
“The first step towards getting somewhere is to decide that you are not going to stay where you are.”
We believe timely and relevant data is key to making good decisions. To this end, we are committed to providing our community and clients with actionable data and insights about the local real estate market.
Local real estate market
With the data from December 2022 in, here’s a snapshot of the key aspects of the local market. The data is collected from Northwest Multiple Listing Service (NWMLS).
Median price: The chart below shows the median sales prices of homes over the past five years. Since our buyers typically buy properties in King, Snohomish, and Pierce Counties, here’s the YOY median closed price increase in these counties over the past 12 months:
King: +8.1%
Snohomish: +11.8%
Pierce: +8.4%
To put these numbers in perspective, note that S&P 500 and Nasdaq have moved by -19.4% and -12.8%, respectively.
And here are the median sold prices of residential properties over the past three years:

New construction: 726 new construction homes were sold in December 2022. The median sale price of new construction homes was $740,000.
Months of inventory: At the current rate of sales, it’ll take 2 months for every listed home to sell. To put this number in context, note that the months of inventory for a balanced market is considered to be 4 to 6 months. So the current value of 2 indicates the persistent shortage of supply relative to demand.
Homes sold: 4,524 homes were sold in December 2022. This translates to a dollar value of $3.11B.
New listings: 2,980 new listings were added to the NWMLS database in December 2022. This is a decrease of -35.5% from December 2021. This indicates fewer property owners are interested in selling their homes exacerbating the chronic shortage of supply.
Mortgage rates: Mortgage rates have climbed down from their peak in October 2022. Buying down rates remains a popular strategy for buyers to lock in lower rates.

30 Year Fixed Mortgage Rates — January 2022 to January 2023 (Source: Freddie Mac)
Broader economy
Consumer Inflation Continues to Ease: The Consumer Price Index (CPI), which measures inflation on the consumer level, showed that inflation decreased by 0.1% in December. 2022 On an annual basis, inflation declined from 7.1% to 6.5%. Core CPI, which strips out volatile food and energy prices, rose 0.3%. As a result, year-over-year Core CPI decreased from 6% to 5.7%. All of these figures were in line with estimates.
Market Update — December 2022
The latest local market data suggests that despite seasonal slowdown, there is pent-up demand for housing. With the data from November 2022 in, here’s a snapshot of the key aspects of the local market. The data is collected from Northwest Multiple Listing Service (NWMLS):
Median price: The median closed price for residential homes and condos increased by 0.9% year over year (YOY) to $575,000. Since our buyers typically buy properties in King, Snohomish, and Pierce Counties, here’s the YOY median closed price increase in these counties:
King: +8.8%
Snohomish: +13.6%
Pierce: +10.1%
To put these numbers in perspective, note that S&P 500 and Nasdaq have moved by -15.6% and -30.1%, respectively.
New construction: 683 new construction homes were sold in November 2022. The median sale price of new construction homes was $690,000, which is down by 0.5% since November 2021.
Months of inventory: At the current rate of sales, it’ll take 2.36 months for every listed home to sell. This number was 0.51 in November 2021. To put these numbers in context, note that the months of inventory for a balanced market is considered to be 4 to 6 months. This indicates the persistent shortage of supply relative to demand. It seems the market is inching toward stability although homes are still under-supplied.
Homes sold: 5,194 homes were sold in November 2022. This translates to a dollar value of $3.68B.
New listings: 4,890 new listings were added to the NWMLS database in November 2022. This is a decrease of -24.2% from November 2021.
Buyers insights: While interest rates are going up, two factors help counter higher rates
More lenders are now offering temporary rate buy-down options. This helps buyers to tide over the next couple of years before a potential refinance.
Home prices are growing at a slower pace, which gives a typical buyer more power than they had over the last few years.
Market Update — November 2022
Investing in real estate in Snohomish, Pierce, and King counties continues to deliver strong results even while the broader economy is struggling. With the data from October 2022 in, here’s a snapshot of the key aspects of the local market. The data is collected from Northwest Multiple Listing Service (NWMLS):
Median price: The median closed price for residential homes and condos increased by 3.5% year over year (YOY) to $59523,000. Since our buyers typically buy properties in King, Snohomish, and Pierce Counties, here’s the YOY median closed price increase in these counties:
King: +8.8%
Snohomish: +25%
Pierce: +11.8%
To put these numbers in perspective, note that S&P 500 and Nasdaq have moved by -15.2% and -7.5%, respectively.
New construction: 688 new construction homes were sold in October 2022. The median sale price of new construction homes was $699,994, which is up by 0.1% since October 2021.
Months of inventory: At the current rate of sales, it’ll take 2 months for every listed home to sell. This number was 0.66 in October 2021. To put these numbers in context, note that the months of inventory for a balanced market is considered to be 4 to 6 months. This underscores the persistent shortage of supply relative to demand. It seems the market is inching toward stability although homes are still under-supplied.
Homes sold: 6,464 homes were sold in October 2022. This translates to a dollar value of $4.68B.
New listings: 7,260 new listings were added to the NWMLS database in October 2022. This is a decrease of -21.2% from October 2021.
Buyers insights: While interest rates are going up, two factors help counter higher rates
More lenders are now offering temporary rate buy-down options. This helps buyers to tide over the next couple of years before a potential refinance.
Home prices are growing at a slower pace, which gives a typical buyer more power than they had over the last few years.
Market Update — October 2022
With the data from September 2022 in, here’s a snapshot of the key aspects of the local market. The data is collected from Northwest Multiple Listing Service (NWMLS):
Median price: The median closed price for residential homes and condos increased by 5.1% year over year (YOY) to $599,000. Since our buyers typically buy properties in King, Snohomish, and Pierce Counties, here’s the YOY median closed price increase in these counties:
King: +9.6%
Snohomish: +16.7%
Pierce: +14%
As a couple of points of reference from an investment perspective, note that S&P 500 and Nasdaq have moved by -12.6% and -23.7%, respectively.
New construction: 788 new construction homes were sold in September 2022. The median sale price of new construction homes was $749,950, which is up by 12% since September 2021.
Months of inventory: At the current rate of sales, it’ll take 2 months for every listed home to sell. This number was 0.75 in September 2021. To put these numbers in context, note that the months of inventory for a balanced market is considered to be 4 to 6 months. This underscores the persistent shortage of supply relative to demand. It seems the market is inching toward stability although homes are still under-supplied.
Homes sold: 7,504 homes were sold in September 2022. This translates to a dollar value of $5.45B.
New listings: 9,422 new listings were added to the NWMLS database in September 2022. This is a decrease of -17.2% from September 2021.
Takeaway: What we see in the market is that despite the slowing demand due to higher interest rates, property prices continue to rise, albeit at a slower rate. But why is that? The main reason is the tight supply: In addition to the chronic shortage of homes in the local market, the slower rate of home price increase has driven a portion of potential sellers to hold off, which has in turn driven the supply even lower than usual.
Buyers insights: While interest rates are going up, two factors help counter higher rates
More lenders are now offering temporary rate buy-down options. This helps buyers to tide over the next couple of years before a potential refinance.
Home prices are growing at a slower pace, which gives a typical buyer more power than they had over the last few years.
Market Update — September 2022
With the data from August 2022 in, here’s a snapshot of the key aspects of the local market. The data is collected from Northwest Multiple Listing Service (NWMLS):
Median price: The median closed price for residential homes and condos increased by 3.6% year over year (YOY) to $600,000. Since our buyers typically buy properties in King, Snohomish, and Pierce Counties, here’s the YOY median closed price increase in these counties:
King: +9.7%
Snohomish: +17.7%
Pierce: +14.1%
As a couple of points of reference from an investment perspective, note that S&P 500 and Nasdaq have moved by -11.1% and -12.1%, respectively.
New construction: 726 new construction homes were sold in August 2022. The median sale price of new construction homes was $738,950, which is up by 6.3% since August 2021.
Months of inventory: At the current rate of sales, it’ll take 1.84 months for every listed home to sell. This number was 0.7 in August 2021. To put these numbers in context, note that the months of inventory for a balanced market is considered to be 4 to 6 months. This underscores the persistent shortage of supply relative to demand. It seems the market is inching toward stability although homes are still under-supplied.
Homes sold: 7,998 homes were sold in August 2022. This translates to a dollar value of $5.94B.
New listings: 9,914 new listings were added to the NWMLS database. This is a decrease of -13.3% from August 2021.
Similar to what we saw back in August 2022, the observation here is that buyers might still have to compete with other would-be homeowners, and depending on the property, some sellers are receiving offers over their asking price.
Buyers insights: While interest rates are going up, two factors help counter higher rates
More lenders are now offering temporary rate buy-down options. This helps buyers to tide over the next couple of years before a potential refinance.
Home prices are growing at a slower pace, which gives a typical buyer more power than they had over the last few years.
Market Update — August 2022
With the data from July 2022 in, here’s a snapshot of the key aspects of the local market. The data is collected from Northwest Multiple Listing Service (NWMLS):
Median price: The median closed price for residential homes and condos increased by 6.1% year over year (YOY) to $625,000. Since our buyers typically buy properties in King, Snohomish, and Pierce Counties, here’s the YOY median closed price increase in these counties:
King: 10.1%
Snohomish: 20%
Pierce: 16.7%
New construction: 679 new construction homes were sold in July 2022. The median sale price of new construction homes was $809,000, which is up by 19.5% since July 2021.
Months of inventory: At the current rate of sales, it’ll take 2.01 months for every listed home to sell. This number was 0.73 in July 2021. To put these numbers in context, note that the months of inventory for a balanced market is considered to be 4 to 6 months. This underscores the persistent shortage of supply relative to demand. It seems the market is inching toward stability although homes are still under-supplied.
Homes sold: 7,645 homes were sold in July 2022. This translates to a dollar value of $5.86B.
New listings: 11,805 new listings were added to the NWMLS database. This is a decrease of -8.6% from July 2021.
The observation from the field is that buyers still have to compete with other would-be homeowners, and depending on the property, some sellers are receiving offers over their asking price.
Market Update — July 2022
With the data from June 2022 in, let’s go over some key aspects of the market. The data is collected from Northwest Multiple Listing Service (NWMLS):
Median price: The median closed price for residential homes and condos increased by 10.4% year over year (YOY) to $650,000. Since our buyers typically buy properties in King, Snohomish, and Pierce Counties, here’s the YOY median closed price increase in these counties:
King: 12%
Snohomish: 21.7%
Pierce: 16.7%
New construction: 763 new construction homes were sold in June 2022. The median sale price of new construction homes was $756,650, which is up by 11.7% since June 2021.
Months of inventory: At the current rate of sales, it’ll take 1.48 months for every listed home to sell. This number was 0.58 in June 2021. To put these numbers in context, note that the months of inventory for a balanced market is considered to be 4 to 6 months. This underscores the persistent shortage of supply relative to demand.
Homes sold: 9,047 homes were sold in June 2022. This translates to a dollar value of $7.25B.
New listings: 14,223 new listings were added to the NWMLS database. This is an increase of 8.5% from June 2021.
Compared to a year ago, we see a healthy jump in inventory, double-digit drops in both pending and closed sales, and the smallest year-over-year (YOY) increase in prices since June 2020.
What does it mean in practical terms? The data shows signs of creating opportunities for buyers. In my own experience, for the first time in a few years, I see now my buyers are able to ask for a (minimal) price reduction, which would have been unthinkable for the most of 2020 and 2021.
Market Update — June 2022

With the data from May 2022 in, let’s go over some key aspects of the market. The data is collected from Northwest Multiple Listing Service (NWMLS):
Median price: The median closed price for residential homes and condos increased by 12.8% year over year (YOY) to $660,000.
New construction: 910 new construction homes were sold in May 2022. The median sale price of new construction homes was $770,228, which is up by 15% since May 2021.
Months of inventory: At the current rate of sales, it’ll take 0.97 months for every listed home to sell. This number was 0.59 in May 2021. To put these numbers in context, note that the months of inventory for a balanced market is considered to be 4 to 6 months. This underscores the persistent shortage of supply relative to demand.
Homes sold: 9,096 homes were sold in May 2022. This translates to a dollar value of $7.44B.
New listings: 13,075 new listings were added to the NWMLS database. This is an increase of 9.7% from May 2021.
To summarize, the market continues to face an upward price trend, which is driven in large part by a shortage of supply.
How to think about the rising inflation and mortgage rates?
It all begins with an idea.

Disclaimer: This material has been prepared for informational purposes only, and is not intended to provide, and should not be relied on for tax, legal, financial, or accounting advice. You should consult your own tax, legal, financial, and accounting advisors before engaging in any real estate transaction.
What does the 40-year high inflation rate of 8+% mean to a prospective home buyer in the Greater Seattle area? This is a multifaceted subject, and in this brief write up we will highlight how you should reason through the current environment.
Rising home prices: The following figure shows the median home prices in King, Snohomish, and Pierce Counties as well as the entire Northwest Multiple Listing Service (NWMLS) from January 2021 till the end of May 2022. We can see clearly that prices continue to rise. This observation is consistent with the historical strength of real estate as an inflation hedge indicating that high inflation tends to boost home prices.
Rising interest rates: To get inflation under control through lowering the supply of money, the Federal Reserve has recently increased the benchmark rate and has signaled that more increases are likely to come. This, in turn, has increased mortgage interest rates. While a higher interest rate tends to lower the number of potential home buyers (hence lowering the demand), this is unlikely to make a fundamental dent in the home prices in the Greater Seattle area for two reasons:
Very low supply of real estate: The chronically low supply of homes in the Greater Seattle area is likely to counter the effect of any marginal decrease in demand on prices. As an example, a typical 3-bedroom home in King County has sold at or above the listing price over the past decade. In other words, the low supply of homes in the area can make multiple buyers compete over the same home. There have been numerous cases of multiple buyers trying to outbid each other to buy a listed home. Considering the tight home supply in the area (driven by the high cost of labor and materials as well as stringent regulations), it seems unlikely that a marginally lower demand (driven by the rising mortgage rates) could lower home prices in a substantial and sustainable manner.
Continued arrival of skilled professionals: The Greater Seattle area is home to headquarters and satellite offices of some of the world's leading companies. This factor continues to bring in highly in demand skilled (and typically well-paid) professionals. The influx of these professionals adds to the pool of qualified home buyers and helps sustain the upward pressure on real estate prices in the area.
Sentiments around the rising mortgage rates: Having a choice, nobody prefers to borrow at a higher interest rate. So if you don’t like the rising rates as a buyer, you’re not alone, and that feeling is completely natural. To make a good buying decision though, you need to think like a businessperson:
Mortgage interest rates are only meaningful in the context of the inflation rate: A high inflation rate diminishes the consumer’s buying power for food, rents, home, and everything in between faster. Therefore, you should think of mortgage interest rates not as absolute numbers but relative to the inflation rate. For example, with the inflation at a 40-year high of 8+%, if you borrow at 6% to buy a home and your home appreciates in value at an annual rate of 8+%, you’re doing a fantastic job of beating the inflation.
You’re not necessarily stuck with the interest rate you borrow at: You could (and probably should) refinance your loan in the future when the mortgage interest rates eventually fall. Refinancing your mortgage in the future can allow you to take advantage of better rates and, optionally, take cash out of the equity you build up by then (i.e., cash out refinance). In contrast, if you withhold from buying a home until rates come down (for example, in two years), you will be missing out on the appreciation gain of your home in the meantime – the cost of this missed opportunity can be hundreds of thousands of dollars.
Conclusion: While we cannot predict the future, our goal here is to share our insights driven by our real estate investing experience in the area, continued research, and interactions with clients and real estate professionals. Given the factors we laid out above, we are planning on buying more investment properties this year to add to our own investment portfolio. It’s one thing to tell others what to do with their money, and quite another to share with you what we’re actually doing with ours.
Your action items:
Let’s talk about your goals and come up with a plan tailored to your needs and aspirations. We will go through your goals, thoughts, concerns, and find the best path forward for you.
If you’re considering buying, get your mortgage rate locked as soon as you can. Once you lock the rate, you could go shopping knowing that any further interest rate increases, as signaled by the Federal Reserve, won’t affect your mortgage rate over the lock period. (Note that not all lenders offer rate locking. We’d be happy to refer you to lenders who do so.)
Wealth creation through residential rental property investing
It all begins with an idea.

Disclaimer: This material has been prepared for informational purposes only, and is not intended to provide, and should not be relied on for tax, legal, financial, or accounting advice. You should consult your own tax, legal, financial, and accounting advisors before engaging in any real estate transaction.
The first step towards getting somewhere is to decide that you are not going to stay where you are.
– J. P. Morgan
There are many ways to succeed as a real estate investor, and there is plenty of relevant educational content. We wrote this document to serve as a brief introduction to residential rental property investing. The target audience is a busy professional with an analytical and long-term mindset who is looking to gain a broad understanding of the key aspects of the topic and is considering investing in Washington State, especially, the Greater Seattle area.
First, we’ll provide a quick overview of the residential real estate market in Washington State. Then we’ll walk you through the four key drivers of wealth creation in real estate investments followed by a few tactical moves to accelerate your growth.
Market overview
Why has investing in residential properties served millions of people in the United States as a wealth creation vehicle? Fundamentally, this is driven by supply and demand: as population grows, job opportunities in major urban hubs and their suburbs continue to attract more people. At the same time, available and buildable land in desirable locations diminishes over time due to growing real estate development. The interplay between the increasing demand on the one hand and the decreasing supply on the other hand drives the price of real estate assets up over time.
Understanding the market is a key success factor in any investment. So before discussing the specifics of wealth creation through residential rental property investing, it is helpful to understand the local market a little better. To put the supply and demand forces in context, let’s look at a few data points from the local market. The population of Washington State increased by 1M from 6.7M to 7.7M people over the past decade. 70% of this increase (i.e., 700,000) was due to the population growth of the Greater Seattle Area. And this population growth is not just any population growth: Let’s go a little deeper by noting that about 10% of the population of the Greater Seattle area work in tech and that 62.6% of adults in the area are college graduates (#1 in the US). Despite the growing population, over the past decade, only 350,000 new housing units were built in Washington State. This persistent shortage of supply (which has been exacerbated by the increasing cost of development) combined with the growing pool of qualified buyers has manifested itself in the growing home prices.
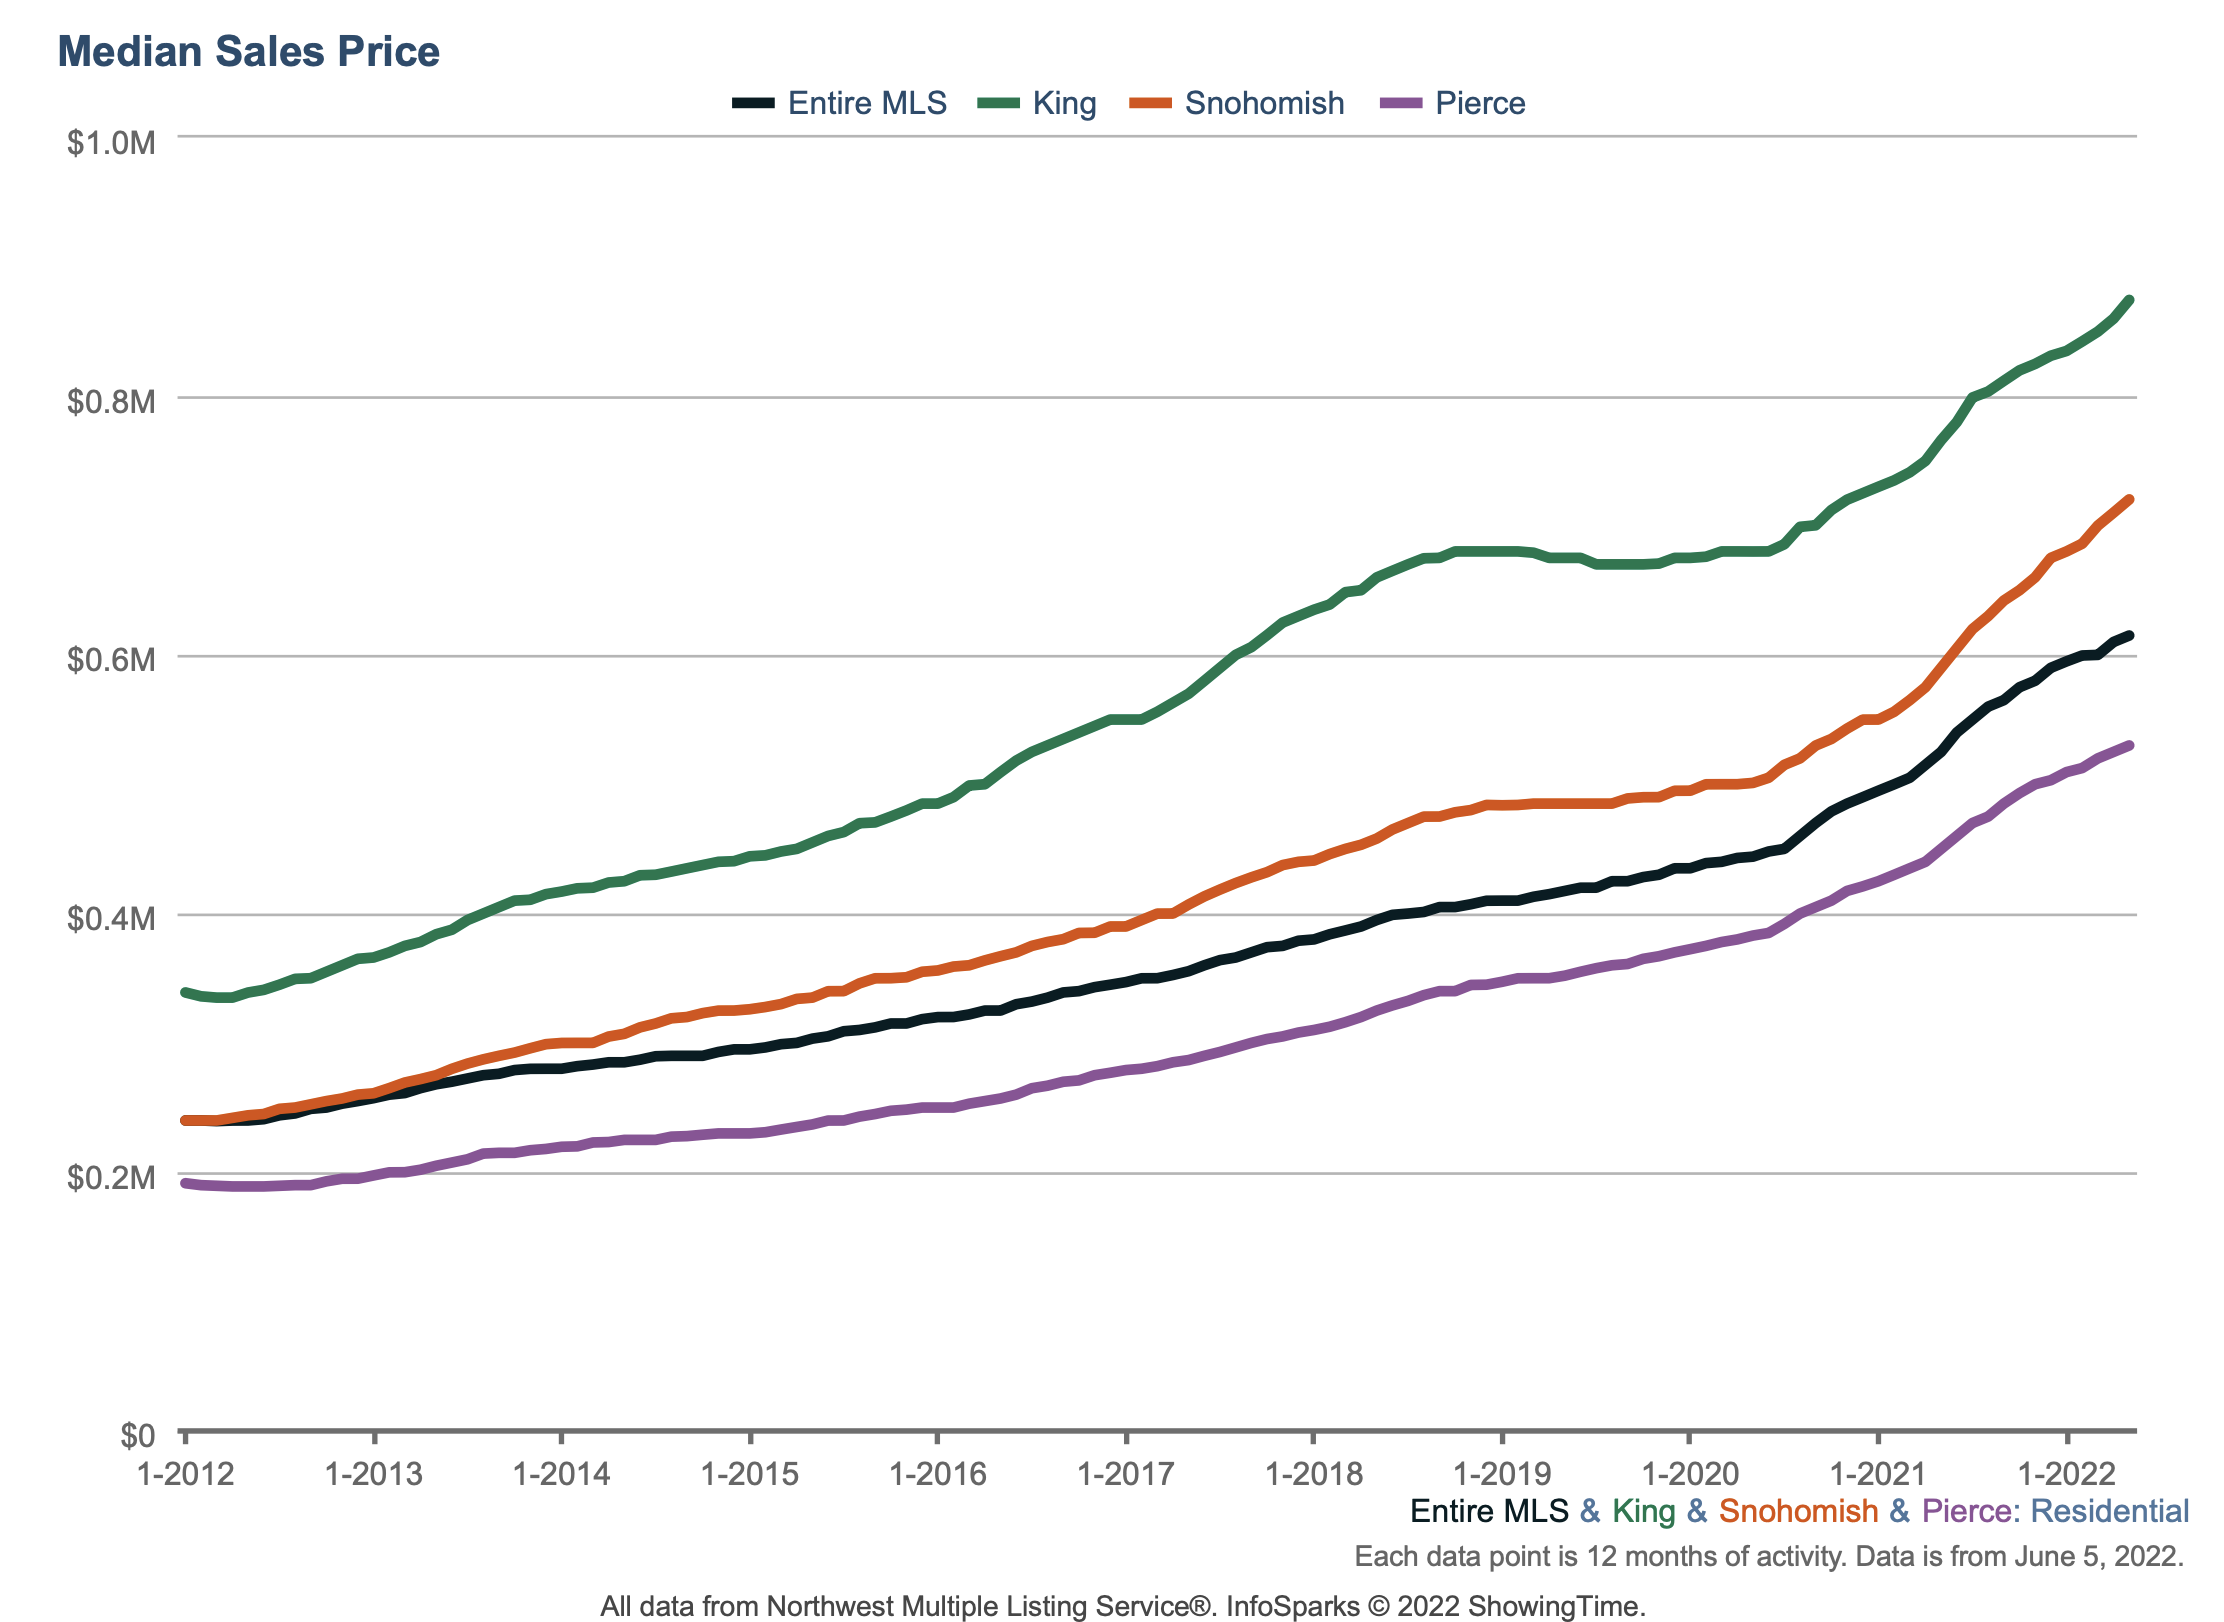
Let’s consider the two cities of Bellevue and Lynnwood, both located in the Greater Seattle area. According to the Northwest Multiple Listing Service (NWMLS), the price of a typical home in Bellevue has increased by 227% from $535K to over $1.75M over the past decade (i.e., an annual growth rate of 12.5%). Over the same time period, a typical home’s value in Lynnwood has grown from $260K to $775K – an increase of 198%, which is equivalent to an annual increase of 11.5% (Figure 1). While price points in Bellevue and Lynnwood are quite different, the growth rates are similar. As a point of reference, over the past decade, the value of a typical US home has increased by 96% from $163K to $320K, which translates into an annual growth rate of only 7%.

Figure 1 Median home sales price in the decade leading to May 2022 (source: NWMLS)
The upward price trend is similar if we look at the price per square foot in these areas (Figure 2).
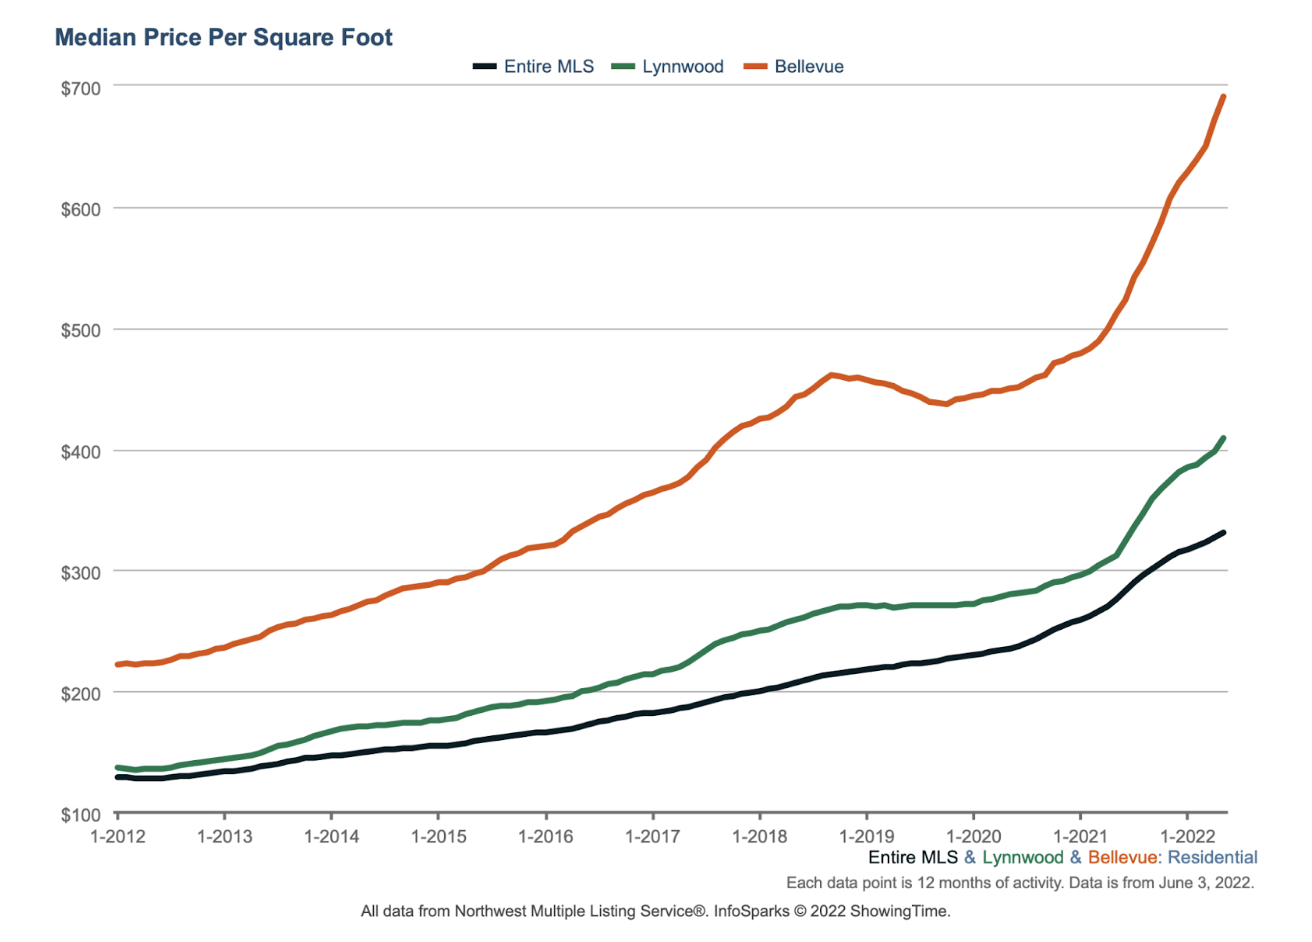
Figure 2 Median home price per square foot in the decade leading to May 2022 (source: NWMLS)
Let’s look at the local real estate market growth from another perspective by considering days on market, which measures how long it takes to sell a home. Over the past decade, the median days on market for residential properties has been pushed down by a factor of 10, demonstrating an increasing supply shortage (see Figure 3).

Figure 3 Median home days on market over the decade leading to May 2022 (source: NWMLS)
Looking forward, while the local real estate market can experience short-term downturns, its strong performance is expected to continue in the long run because of the fundamental supply and demand forces, namely, a world-class local job market bringing in new population (both nationally and internationally) as well as a diminishing supply of buildable land combined with an increasing cost of development.
One last note on the market. As of early 2022, there are market signals pointing to potentially higher inflation rates in the coming years. In contrast to certain asset categories that may not perform very well in a high-inflation environment (e.g., tech stocks), real estate has historically done well as an inflation hedge.
What we outlined in this section sheds some light on why home prices in the area follow a strong upward trend. However, when you invest in real estate, price appreciation is only one of the contributing factors to your wealth. So taking a step back, the question is how exactly investing in residential rental properties can create wealth for you. The next section answers this question.
The four wealth creation drivers
Next let’s look at the four key drivers of wealth creation through residential real estate investing that act in distinct, simultaneous, and harmonious ways: appreciation, rental cash flow, tax benefits, and debt pay-off.
Wealth creation driver 1: Appreciation
The market overview presented in the previous section indicates why buy-and-hold residential real estate investors tend to do well: an increase in the market value of a rental property directly translates into an increase in the net worth of the owner. While it sounds intuitive, let’s dig a little deeper.
As a simplified example, suppose you buy a property in 2022 for $1M using a conventional mortgage with a 20% down payment. Assuming an annual growth rate of 8% (which is quite modest with the past decade in mind) the property will be worth about $1.36M in 2026. Now what would that mean to you as the investor?
Your net worth has increased by $360K. This is because once you buy a property, every dollar of market value appreciation of the property adds to your equity while having no effect on your loan balance. You owe the lender only the remaining loan balance regardless of the appreciation (in this example, your loan balance in 2026 will be the initial $800K less any principal paid off by 2026).
Of course, a $360K increase in net worth is nice, but as an investor, you also want to know what your return on investment (ROI) through appreciation is. While your property’s value has increased by an annual rate of 8%, that is not your ROI via appreciation. Your equity has gone from $200K in 2022 to $560K in 2026, which means your annualized ROI is 29%.
Why has your investment home increased in value by only 8% per year but your annualized ROI through appreciation is 29%? That is the power of leverage, which means buying assets using loans. Leverage is a common tool in the toolbox of wealthy individuals and prosperous businesses. (Note that if you bought the same property using all cash in 2022, while appreciation would still increase your net worth by $360K, your annual ROI due to appreciation would be only 8%.)
Wealth creation driver 2: Rental cash flow
In addition to appreciation, a residential rental property can act as a cash-flowing entity over time. When you buy and rent a residential property, one of your targets should be making sure the rental income covers an increasing portion (if not all) of your monthly mortgage payments. Depending on factors such as the purchase price, down payment percentage, mortgage terms, maintenance and administrative costs, and monthly rent, you’ll start off with a specific dollar value of positive or negative monthly cash flow in year 1. Many investors start off somewhere in the vicinity of the break-even point. From that point on, you will be gradually increasing the rent year after year, which will continuously improve your rental cash flow. Why does your rental cash flow improve over time? That’s because while your rental income increases, your mortgage payments largely remain constant over the life of the loan for many types of mortgages. This increasing positive cash flow provides a source of income for you.
Wealth creation driver 3: Tax benefits
W-2 jobs and real estate investments involve very different tax treatments. If you make $250K from your W-2 job, you might end up owing about $70K in income taxes. But if you make $250K through real estate investments, you might be able to pay $0 in taxes depending on the specifics of the scenario. While taxation is too complex to fully explore, here is an overview of four key tax advantages of owning investment properties:
Tax-deferred exchanges: 1031 exchanges allow you to defer capital gain taxes of investment properties indefinitely. This makes it a truly powerful wealth creation tool because a capital gain tax rate of 15% or 20% on the appreciated value of a rental property would translate into a significant number.
Let’s take a quick look at what a 1031 exchange is and how it works. According to Section 1031 of the US tax code, when an investment property is “exchanged” with another “like-kind” investment property, recognizing any realized gain can be deferred. In effect, using a 1031 exchange, you can sell one or multiple investment properties and buy one or multiple investment properties subject to certain rules. The definition of an investment property is broad (e.g., a single family rental, raw land, a rental office, a multiplex, an apartment building, a condo, an industrial building, etc.).
The buying and selling don’t need to be done with the same party, meaning you can sell to one party and buy from another party. There is a time limit that must be followed: you have 45 days to identify a replacement property and the purchase of the replacement property must close within 180 days of the sale of the relinquished property.
One last note on the inter-generational power of this tool: All of the otherwise taxable built-in gain disappears upon the taxpayer's death. This means the fair market value of the property at the taxpayer’s death would pass through the estate to the heirs with no tax obligation on the appreciation!
Tax deductions: The following items are deductible in a real estate rental business (subject to applicable rules and limits):
Repair expenses (a repair expense is incurred to keep the property in ordinary, efficient, and operating condition.)
Mortgage interest expenses
Property taxes
Various business expenses such as transportation expenses, costs associated with managing your rentals, your home office expenses (e.g., a portion of your home’s utility costs), insurance on your rental, business meals, business trips, and more
The value of the the building but not the land is deductible based on a depreciation schedule – over a period of 27.5 or 39 years depending on whether it is a residential or commercial property
Adjusted basis: If you decide to sell an investment property, similar to any capital asset, it will involve tax liability. However, for an investments property, all capital expenditures (which are expenditures made to improve the property, such as adding a bedroom or remodeling the kitchen) are added to the initial basis (which is the actual amount of investment, typically composed of the cost to acquire the property plus the closing costs) to arrive at an adjusted basis. In effect, this means the capital expenditures are treated in the same manner as the cost to acquire the property, and therefore, reduce your capital gain tax obligation.
Exemption from the new Washington State capital gain tax: The 2021 Washington State Legislature recently passed a law which creates a 7% tax on the sale or exchange of long-term capital assets (stocks, bonds, business interests, and many tangible assets) when the gain is $250,000 or more. Note that this new tax law is currently being contested in the Washington Supreme Court. Regardless of the outcome of the contest and fortunately for real estate investors, real estate is exempted from this tax.
Wealth creation driver 4: Debt pay-off
When you buy a rental property using a loan, as you gradually pay off the principal portion of the mortgage, your loan balance diminishes. This means your equity in the property gradually goes up by the same amount.
Wealth maximization tactics
In addition to the above key wealth creation drivers that work for you to increase your wealth, here we will look at a few tactical tools you can optionally leverage to further accelerate your wealth growth.
Rehab: When you rehabilitate an investment property, there are two positive outcome:
Forced appreciation. Instead of solely relying on the market to raise the value of your property over time, here you are pushing up the value of the property in a short period of time (e.g., through a 3-month rehab project).
Forced rent increase. Instead of just waiting for the market to increase the monthly rent, you can increase the rental cash flow by occasionally rehabilitating the property.
The key to a successful rehab project is targeted improvements. This means you need to be selective about which parts of the property to improve and which parts to leave alone in order to maximize your return. While rehab is an extensive topic, generally speaking, targeted cosmetic improvements as well as improvements involving adding square footage and adding bedrooms and/or bathrooms tend to yield the highest return.
Refinance: When you refinance a property, you replace the old loan with a new one. There are at least three reasons to consider refinancing a rental property:
Taking advantage of lower interest rates: If the current market interest rates are significantly lower than your loan’s interest rate, it might make sense to refinance in order to lower your monthly mortgage payments despite the closing costs of the new loan.
Increasing your return on equity (ROE) through cash-out refinancing: Return on equity (ROE) is a financial metric to see how well the equity is put to use. Intuitively, for an investment property renting at a given monthly rent, the higher your equity the lower your ROE. For example, an equity of 75% in one of your rentals is quite significant. While it contributes to your net worth, it might not be the most productive use of your capital. A cash out refinance allows you to pull out a percentage of your equity in the form of a loan and put it to whatever use you see fit (e.g., as the down payment to acquire more investment properties). Many lenders require the owner to maintain a minimum of 20% to 25% equity. So in the above example, you’d be able to pull out the equivalent of 50% to 55% of the appraised value of the property (e.g., $500K to $550K if the property is appraised at $1M).
Reducing your legal liability by keeping a low/moderate equity: Suppose one of your tenants slips and gets injured on your property and proceeds to seek legal help. All else being equal, if your equity in this particular property is 75%, you are a more attractive target for a lawsuit compared to the case where your equity is only 20%.
Conversion: Your primary residence (meaning where you live) and your investment properties involve different lending rules and tax treatments. By tactically planning your moves, you can mix and match and take advantage of the best of both worlds. For example, you might be able to buy a property, rent it for a while, then move in and live there for two years, and then be able to sell it while enjoying a tax exemption on up to $250,000 (if you’re single) or $500,000 (if you’re married) of your capital gain. There are many more opportunities enabled by converting a property. Conversion is an accounting process and your accountant can help you proactively identify potential conversion opportunities.
Wealth protection: A major requirement for becoming (and staying) wealthy is to not lose all or most of your money. You work hard to get wealthy. You don’t want to lose it all due to a slip and fall injury lawsuit. Asset protection is a big topic, and you should seek legal advice to build multiple layers of protection. At a minimum, you should consider the common practice of putting each of your rental properties under a separate legal entity (e.g., an LLC) to minimize your risk exposure in the case of a potential lawsuit. Another common wealth protection practice is equity stripping, which refers to reducing your equity in your properties (e.g., through cash-out refinance) to make it less attractive to judgment creditors.
A few important things to keep in mind
Before wrapping up, we’d like to highlight a few things that we have found important:
Your mindset: As a real estate investor, there are many levers at your disposal (e.g., purchase, rehab, 1031 exchanges, refinance, sale, conversion from a rental to a primary residence, rent increase, etc.) that allow you to creatively optimize your financial position in response to your changing goals, opportunities, and challenges. However, these levers are not instantaneous — for example, you can’t rehab or sell a property instantly the way you can trade shares of stocks. Further, at times, you need to patiently let the market dynamics play out. As a result, a long-term buy-and-hold mindset combined with creative thinking works well in real estate. To illustrate this, note that after the financial crisis of 2007-8, home prices in the Seattle area took about three years to get back up to their pre-crisis levels (and then proceeded to soar from there on). For long-term investors with a properly managed portfolio of rentals and sufficient liquidity, the price dip due to the crisis presented a tremendous opportunity to buy more properties. Today these investors are some of the wealthiest individuals we know of. The takeaway here is this: while it is possible to make some profit on a short-term project, to give yourself the best chance of creating significant, generational wealth, your planning horizon should be years or ideally decades.
When to buy your first investment property: The sooner the better. This is because wealth creation takes time, so the later you start the later you’ll benefit from the four wealth creation drivers. Having said that, starting can feel scary. You might feel you’re not 100% ready or the market timing is not the best right now. The truth is you will never be 100% ready and optimizing to catch the absolute best market timing is impossible. The right approach is to educate yourself to a reasonable level of competence and then jump in. Real education happens out there in the field. Start small and gradually expand your portfolio.
Your debt: Your mortgages need to be paid in good times and bad; otherwise, you’ll suffer from adverse credit consequences. While borrowing is a very powerful tool in wealth creation when done right (as we discussed earlier), it can also lead to financial failure if not approached correctly. There will be market ups and downs. There will be vacancies. You’ll occasionally have tenant problems. While many kinds of problems can be proactively minimized with due diligence and having the right team around you, challenges will arise from time to time. And yet, you, as the borrower, are responsible for servicing your debts. To do so, you need to maintain sufficient liquidity to cope with transient adverse situations and make sure to continuously raise rent over time to provision your rental cash flow as a defense mechanism.
Your team: The quality of your team directly impacts the outcome. While you, as the investor, are in the driver’s seat, you need a team of professionals to succeed. This team includes your real estate broker, lender, lawyer, accountant, property manager, insurance agent, banker, and contractors. Their mistakes will cost you money and their expertise will multiply your success. Choosing the right team members and creating long-term, win-win relationships with them is a great way to set yourself up for success.
Your next step
If you’ve read this far, you have the desire to financially thrive. We hope this short document helped you learn something new and concrete. Hopefully, this write up provides you with an organized way of starting to think about building and expanding your own real estate portfolio. We’d love to speak with you about your real estate goals, share our investment results and learnings, and guide you in your wealth creation journey as your real estate broker and advisor.
Should you buy or rent your home?
It all begins with an idea.

Disclaimer: This material has been prepared for informational purposes only, and is not intended to provide, and should not be relied on for tax, legal, financial, or accounting advice. You should consult your own tax, legal, financial, and accounting advisors before engaging in any real estate transaction.
The first step towards getting somewhere is to decide that you are not going to stay where you are.
– J. P. Morgan
Should you rent or own where you live? This is a natural question many prospective first-time home buyers ask themselves. In this brief write up, we explore this question in the context of the Greater Seattle Area and lay out a data-driven and factual framework as to why we believe home ownership is the right approach if you value wealth creation.
First, to better understand the broader context of home ownership, I’ll provide a quick overview of the residential real estate market in Washington State. Then I’ll walk you through the three key drivers of wealth creation through home ownership followed by a few tactical moves to accelerate your growth.
Market overview
Why has home ownership served tens of millions of people in the US as a wealth creation vehicle? Fundamentally, this is driven by supply and demand: as population grows, major urban hubs and their suburbs continue to attract more people. At the same time, available and buildable land in desirable locations diminishes over time. This dynamic drives the price of real estate assets up over time.
Before discussing the specifics of wealth creation through home ownership, it is helpful to understand the local market a little better. To put the supply and demand forces in context, let’s look at a few data points from the local market. The population of Washington State increased by 1M from 6.7M to 7.7M people over the past decade. 70% of this increase (i.e., 700,000) was due to the population growth of the Greater Seattle Area. And this population growth is not just any population growth: Let’s go a little deeper by noting that about 10% of the population of the Greater Seattle area work in tech and that 62.6% of adults in the area are college graduates (#1 in the US). Despite the growing population, over the past decade, only 350,000 new housing units were built in Washington State. This persistent shortage of supply (which has been exacerbated by the increasing cost of development) combined with the growing pool of qualified buyers has manifested itself in the growing home prices.
Let’s consider the two cities of Bellevue and Lynnwood, both located in the Greater Seattle area. According to the Northwest Multiple Listing Service (NWMLS), the price of a typical home in Bellevue has increased by 227% from $535K to over $1.75M over the past decade (i.e., an annual growth rate of 12.5%). Over the same time period, a typical home’s value in Lynnwood has grown from $260K to $775K – an increase of 198%, which is equivalent to an annual increase of 11.5% (Figure 1). While price points in Bellevue and Lynnwood are quite different, the growth rates are similar. As a point of reference, over the past decade, the value of a typical US home has increased by 96% from $163K to $320K, which translates into an annual growth rate of only 7%.
Figure 1 Median home sales price in the decade leading to May 2022 (source: NWMLS)
The upward price trend is similar if we look at the price per square foot in these areas (Figure 2).
Figure 2 Median home price per square foot in the decade leading to May 2022 (source: NWMLS)
Let’s look at the local real estate market growth from another perspective by considering days on market, which measures how long it takes to sell a home. Over the past decade, the median days on market for residential properties has been pushed down by a factor of 10, demonstrating an increasing supply shortage (see Figure 3).
Figure 3 Median home days on market over the decade leading to May 2022 (source: NWMLS)
Looking forward, while the local real estate market can experience short-term downturns, its strong performance is expected to continue in the long run because of the fundamental supply and demand forces, namely, a world-class local job market bringing in new population (both nationally and internationally) as well as a diminishing supply of buildable land combined with an increasing cost of development.
One last note on the market. As of early 2022, there are market signals pointing to potentially higher inflation rates in the coming years. In contrast to certain asset categories that may not perform very well in a high-inflation environment (e.g., tech stocks), real estate has historically done well as an inflation hedge.
What we outlined in this section sheds some light on why home prices in the area follow a strong upward trend. However, when you buy a home, price appreciation is only one of the contributing factors to your wealth. So taking a step back, the question is how exactly buying a home can create wealth for you. The next section answers this question.
The three wealth creation drivers in home ownership
Next we will look at the three key drivers of wealth creation through home ownership, which act in distinct, simultaneous, and harmonious ways: appreciation, tax benefits, and debt pay-off.
Wealth creation driver 1: Appreciation
The market overview presented in the previous section indicates why homeowners tend to do well: an increase in the market value of a rental property directly translates into an increase in the net worth of the owner. While it sounds intuitive, let’s dig a little deeper.
As a simplified example, suppose you buy a property in 2022 for $1M using a conventional mortgage with a 20% down payment. Assuming an annual growth rate of 8% (which is quite modest with the past decade in mind) the property will be worth about $1.36M in 2026. Now what would that mean to you as a home buyer:
Your net worth has increased by $360K. This is because once you buy a property, every dollar of market value appreciation of the property adds to your equity while having no effect on your loan balance. You owe the lender only the remaining loan balance regardless of the appreciation (in this example, your loan balance in 2026 will be the initial $800K less any principal paid off by 2026).
Of course, a $360K increase in net worth is nice, but as an owner, you also want to know what your return on investment (ROI) through appreciation is. While your property’s value has increased by an annual rate of 8%, that is not your ROI via appreciation. Your equity has gone from $200K in 2022 to $560K in 2026, which means your annualized ROI is 29%.
Why has your home increased in value by only 8% per year but your annualized ROI through appreciation is 29%? That is the power of leverage, which means buying assets using loans. Leverage is a common tool in the toolbox of wealthy individuals and prosperous businesses. (Note that if you bought the same property using all cash in 2022, while appreciation would still increase your net worth by $360K, your annual ROI due to appreciation would be only 8%.)
Wealth creation driver 2: Tax benefits
W-2 jobs and real estate involve different tax treatments. While taxation is too complex to fully explore here, let’s have a quick overview of four key tax advantages of owning your home:
Tax deductions: The following items are some of the deductibles for your home (subject to applicable rules and limits):
Mortgage interest
Property taxes
Mortgage points
Homeowners capital gain tax exemption: If/when you decide to sell your home, similar to any capital asset, the transaction will involve capital gain tax liability. The good news is that if you have lived there for at least two years in the past five year, you’ll be able to sell it while enjoying a tax exemption on up to $250,000 (if you’re single) or $500,000 (if you’re married) of your capital gain.
Adjusted basis: What does basis mean? Basis is the amount your home is worth for tax purposes. When you sell your home, it is quite possible that even after taking advantage of the above capital gain exemption to its maximum limit, you still have a capital gain obligation (meaning if you’re single and your capital gain is greater than $250,000, or if you’re married and your capital gain is greater than $500,000). That’s where the idea of adjusted basis helps. Any home improvements you might have made during the course of your home ownership (such as adding a bathroom or remodeling the kitchen) will be added to the initial basis, which is the cost to acquire the property, to arrive at an adjusted basis. In effect, all that means is that your home improvements are treated in the same manner as the cost to acquire the property, and therefore, reduce your capital gain tax obligation. (Note that there are other types of expenses that work in the same way but we won’t mention them here for brevity).
Exemption from the new Washington State capital gain tax: The 2021 Washington State Legislature recently passed a law which creates a 7% tax on the sale or exchange of long-term capital assets (stocks, bonds, business interests, and many tangible assets) when the gain is $250,000 or more. Note that this new tax law is currently being contested in the Washington Supreme Court. Regardless of the outcome of the contest and fortunately for home owners and real estate investors, real estate is exempted from this tax.
Wealth creation driver 3: Debt pay-off
When you pay rent, the money is gone. Unfortunately, there is not any proof of wealth for all the rent you’ve paid in the past. In contrast, when you own your home, as you gradually pay off the principal portion of your mortgage, your loan balance diminishes. This means your equity in the property gradually goes up by the same amount.
Wealth maximization tactics
In addition to the above key wealth creation drivers that work for you to increase your wealth, here we will look at a few tactical tools you can optionally leverage to further accelerate your wealth growth.
Rehab: When you rehabilitate a home, there are two positive outcome:
Forced appreciation. Instead of solely relying on the market to raise the value of your property over time, here you are pushing up the value of the property in a short period of time (e.g., through a 3-month rehab project).
Forced rent increase. Instead of just waiting for the market to increase the monthly rent, you can increase the rental cash flow by occasionally rehabilitating the property.
The key to a successful rehab project is targeted improvements. This means you need to be selective about which parts of the property to improve and which parts to leave alone in order to maximize your return. While rehab is an extensive topic, generally speaking, targeted cosmetic improvements as well as improvements involving adding square footage and adding bedrooms and/or bathrooms tend to yield the highest return.
Refinance: When you refinance a property, you replace the old loan with a new one. There are at least three reasons to consider refinancing a rental property:
Taking advantage of lower interest rates: If the current market interest rates are significantly lower than your loan’s interest rate, it might make sense to refinance in order to lower your monthly mortgage payments despite the closing costs of the new loan.
Increasing your return on equity (ROE) through cash-out refinancing: Suppose at some point down the road your equity in your home reaches 75%. While having a high equity in your home contributes to your net worth, it might not be the most productive use of your capital. A cash out refinance allows you to pull out a percentage of your equity in the form of a loan and put it to whatever use you see fit (e.g., as the down payment to acquire an investment property). Many lenders require the owner to maintain a minimum of 20% equity. So in the above example, you’d be able to pull out the equivalent of 55% of the appraised value of the home (e.g., $550K if your home is appraised at $1M).
Common questions first time home buyers ask
Before wrapping up, we’d like to highlight a few things that we have found important:
Home ownership sounds great, but what about the down payment?
In a high-price market such as the Greater Seattle Area, the down payment can be a barrier to first-time home ownership. While putting 20% down is a common choice, it is by no means the only option. There are a variety of options to buy your home with very little down payment — just ask us about down payment resources.
Should I wait until I can afford to buy my dream home?
Absolutely not. From a wealth creation perspective, the main point of buying your first home as soon as possible is to stop the financial bleeding due to your rent payments and start building wealth. Once you own a home, it is quite likely that after a while your personal, professional, and financial circumstances change and, as a result, you’ll be looking to buy a bigger and nicer house. At that point, you will have a couple of options: (1) Sell your first home given the tax advantages outlined earlier in the write up, or (2) Rent out your first home. Option 2 is the way many real estate investors started their real estate investment journey.
Your next step
If you’ve read this far, you have the desire to financially thrive. We hope this short write up helped you learn something new and concrete about wealth creation through home ownership. We’d love to speak with you about your real estate goals, put together a customized analysis of renting vs. buying for you, share our past results, and guide you in your wealth creation journey as your real estate broker and advisor.